

July 05, 2026 • General • By Sayad Md Bayezid Hosan
MODULE 18: Mobile, Cross-Device & Campaign Analytics — The Complete A to Z Mega Guide for Beginners
A complete, practical A to Z guide to mobile and cross-device analytics for beginners — mobile tracking and responsive design considerations, cross-device tracking with User-ID, understanding campaign tracking, creating UTM parameters that actually hold up in real reporting, analysing marketing campaigns with confidence, tracking social media interactions, integrating Google Analytics with Google Ads, and measuring ad performance the right way in 2026.
Welcome to Module 18: Mobile, Cross-Device & Campaign Analytics
Module 17 gave you the foundation of Google Web Analytics — how GA4 is structured, how events and conversions work, and how to read a report without misreading it. This module builds directly on top of that foundation and points it at a specific, practical problem: your actual audience is not sitting still on one device, and your actual marketing is not one undifferentiated stream of "traffic." A single person might discover your brand on their phone during a commute, research it on a tablet that evening, and finally convert on a laptop three days later. Meanwhile, that same visit could have originated from an Instagram story, a Google Ads campaign, an email newsletter, or a LinkedIn post — and if none of those sources are tagged properly, Google Analytics will lump them all into a vague, unhelpful bucket that tells you almost nothing about what actually worked.
This module exists to close both gaps at once. The first half covers mobile and cross-device analytics — how to think about tracking across screen sizes and, more importantly, how Google Analytics can recognize that three different devices belong to one real person through User-ID. The second half covers campaign tracking and UTM parameters — the small, unglamorous piece of every link that turns "traffic" into "traffic I can actually attribute to a decision I made." And the closing section connects both of those ideas to where a huge amount of marketing budget actually lives: social media and advertising analytics, including how to properly link Google Analytics with Google Ads so spend and revenue finally sit in the same report.
None of this is difficult once you've seen it done correctly. Almost all of it is skipped by beginners simply because it isn't visible the way a dashboard or a chart is — it lives in a query string at the end of a URL, or a setting buried three menus deep in the GA4 Admin panel. This guide puts all of it in one place.
Before diving in, if you haven't already gone through the earlier modules in this course, I'd recommend starting there, since each module builds on the concepts that came before:
- Introduction to Online Digital Marketing: A Beginner's Guide
- Module 3: Social Media Marketing (SMM) — Advertising Concepts and Platform Selection
- Module 4: Meta (Facebook) Marketing — The Complete A to Z Mega Guide
- Module 5: Instagram Marketing — The Complete A to Z Mega Guide
- Module 6: X (Formerly Twitter) Marketing — The Complete A to Z Mega Guide
- Module 7: LinkedIn Marketing — The Complete A to Z Mega Guide
- Module 8: Pinterest Marketing — The Complete A to Z Mega Guide
- Module 9: Creating a WordPress Website — The Complete A to Z Mega Guide
- Module 10: Search Engine Optimization (SEO) — The Complete A to Z Mega Guide
- Module 11: Off-Page Optimization — The Complete A to Z Mega Guide
- A Complete Guide to Automated Sitemap Management for Modern SEO
- Module 13: Algorithm Updates and Analysis — The Complete A to Z Mega Guide
- Module 14: Technical SEO Optimization — The Complete A to Z Mega Guide
- Module 15: Video Marketing Through YouTube — The Complete A to Z Mega Guide
- Module 16: Email Marketing — The Complete A to Z Mega Guide
- Google Web Analytics — The Complete A to Z Mega Guide for Beginners
Why I'm Writing This Guide the Way I Am
Most beginners treat UTM tags and cross-device tracking as optional polish — something to come back to "once the basics are working." I understand exactly why: a UTM parameter doesn't change how your website looks, and cross-device tracking doesn't produce a chart you can screenshot for a client the way a pageviews graph does. But this is precisely the part of analytics where sloppy habits compound the fastest. A single untagged campaign link doesn't just lose you data on that one campaign — it quietly inflates your "Direct" and "Unassigned" traffic buckets, which then distorts every comparison you make between channels for as long as that data sits in your property.
So this guide treats measurement hygiene as a first-class topic, not an afterthought. Every UTM convention, every naming rule, and every linking step described here exists because getting it wrong doesn't just create a small reporting gap — it actively misleads the person reading the report into making a worse decision than they would have made with no data at all.
1. Mobile and Cross-Device Analytics
1.1 Mobile Tracking and Responsive Design Considerations
The starting point for this entire section is a statistic worth sitting with for a moment: in most consumer-facing industries, mobile devices now account for well over half of total website sessions, and in some categories — social commerce, food delivery, local search — that share climbs considerably higher. If your analytics setup, your responsive design, or your conversion tracking was built with a desktop-first mindset and mobile added on afterward, you are very likely measuring your primary audience as an afterthought.
Responsive design is the practice of building a website so its layout, navigation, and content adapt fluidly to whatever screen size is viewing it, rather than serving a completely separate mobile site on a separate subdomain (the older m.example.com pattern). From a pure analytics standpoint, responsive design is strongly preferable to a separate mobile domain for one clear reason: a single responsive URL keeps every session, every UTM tag, and every conversion tied to one consistent page and one consistent GA4 data stream, whereas a separate mobile domain historically created duplicate tracking headaches, split analytics data across two properties, and complicated cross-device measurement considerably.
What to actually check in GA4 for mobile tracking. Inside your GA4 property, navigate to Reports → Tech → Overview, which breaks down your traffic by device category (mobile, desktop, tablet), operating system, browser, and screen resolution. Three things are worth reviewing specifically here on a recurring basis. First, compare your conversion rate by device category — it's extremely common to see mobile carrying the majority of sessions but converting at a meaningfully lower rate than desktop, which is a direct signal that something in the mobile experience (checkout friction, a form that's hard to complete on a small screen, a slow-loading page) is costing you revenue that the top-line traffic numbers alone would never reveal. Second, review average engagement time by device — a large gap here, with mobile users leaving noticeably faster, often points to a responsive design or page speed issue rather than a genuine lack of interest. Third, check screen resolution data periodically, since it tells you the real range of viewport widths your actual audience uses, which is far more useful for prioritizing responsive design fixes than testing against a generic set of assumed breakpoints.
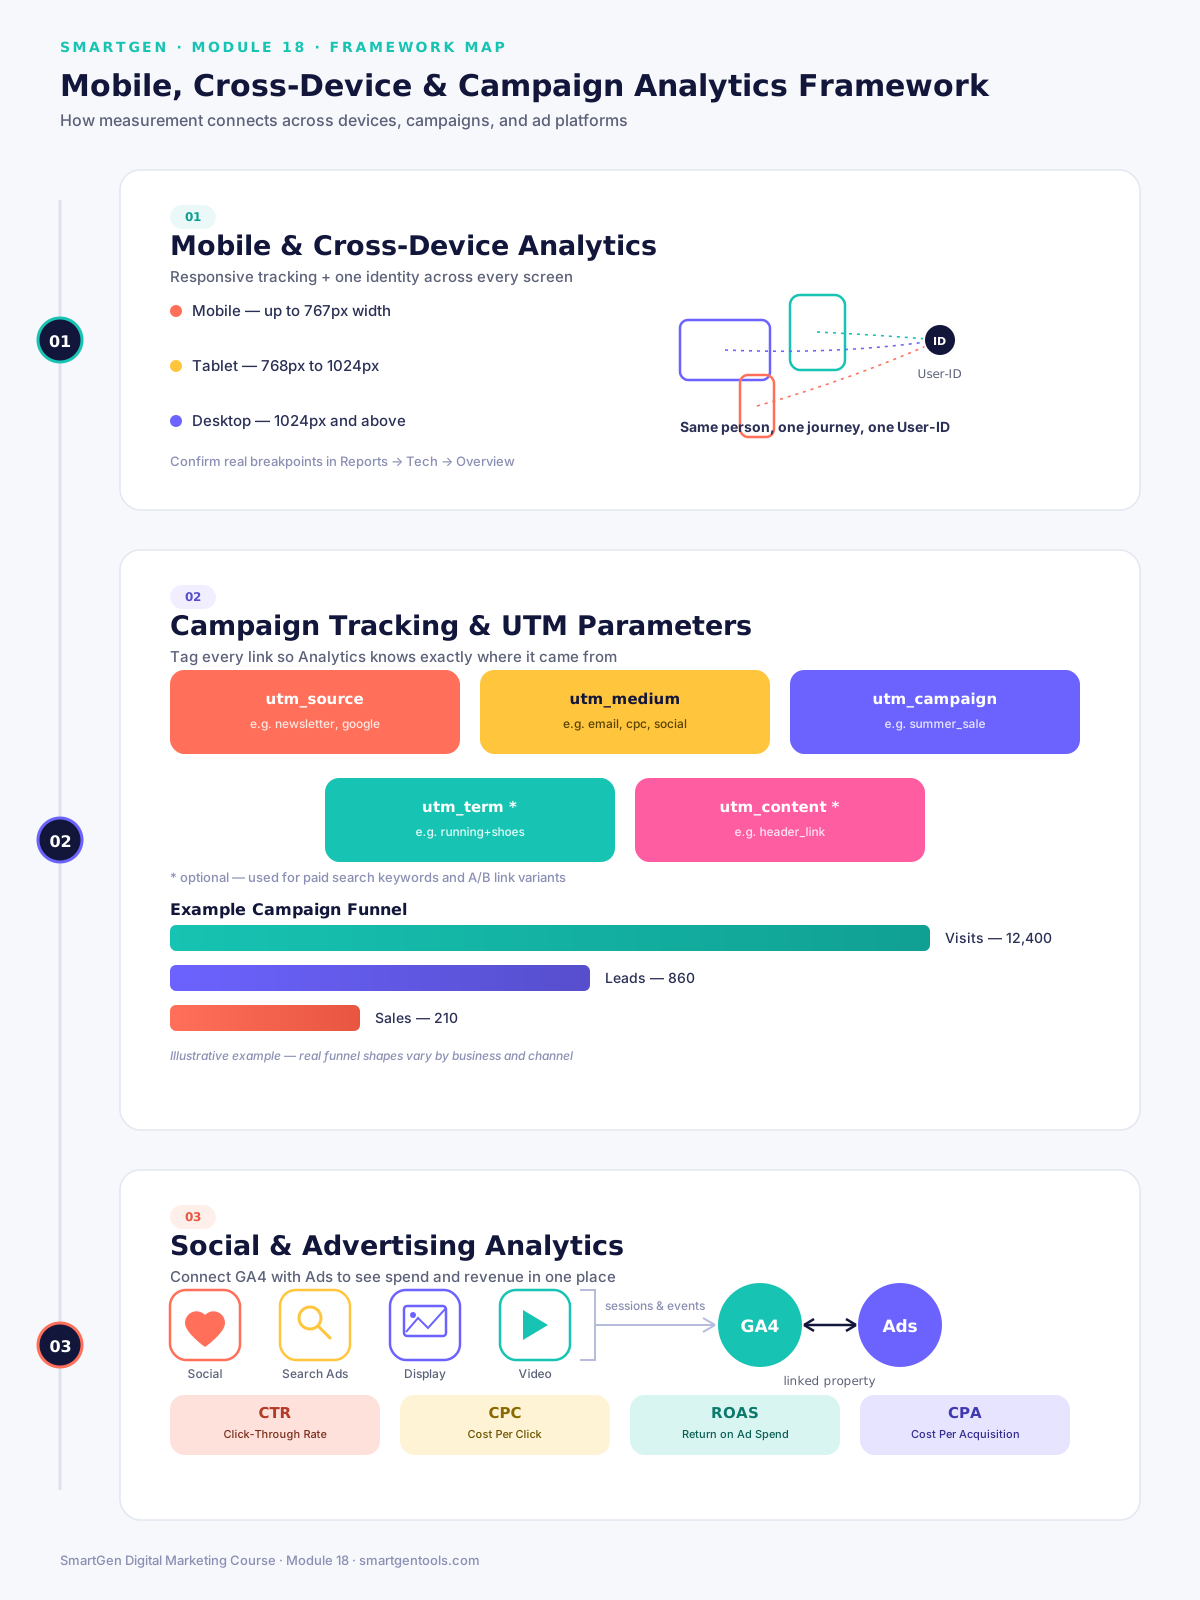
Common responsive design breakpoints and why analytics should inform them. Most modern responsive builds use a small set of breakpoints roughly in this range: below 768px for phones, 768px to 1024px for tablets, and above 1024px for desktop and laptop screens, though the exact pixel values vary by framework and design system. The mistake many beginners make is treating these breakpoints as fixed, universal rules borrowed from a tutorial, rather than checking them against the Tech Overview report for their own actual audience. If a meaningful share of your real visitors use an unusually large or small viewport that falls awkwardly between your chosen breakpoints, your analytics data is the fastest way to find that out before it shows up as an unexplained drop in mobile conversion rate.
Page speed as a mobile analytics issue, not just a technical one. Mobile networks are, on average, slower and less consistent than fixed broadband, which means the same page can perform very differently for a mobile visitor than a desktop one. GA4, combined with Google Search Console's Core Web Vitals report, lets you see whether slow-loading pages correlate with higher bounce and lower engagement specifically on mobile. Treating page speed as a pure technical SEO concern (as it was covered in Module 14) misses half the picture — it's just as much an analytics and conversion concern, because a slow mobile page doesn't just rank worse, it also measurably loses you visitors before a single event can even fire.
1.2 Cross-Device Tracking with User-ID
Here is the core problem this section exists to solve. By default, Google Analytics identifies a visitor using a Client ID — an anonymous identifier stored in a first-party cookie on a specific browser, on a specific device. This works reasonably well for measuring a single session, but it breaks down the moment a real person moves between devices, because a new device (or even a different browser on the same device) generates a completely new Client ID with no inherent connection to the previous one. Left unaddressed, this means a single real customer journey — phone, then tablet, then laptop — shows up in your reports as three separate, disconnected "users," each with their own partial, misleading journey.
User-ID is Google Analytics' solution to exactly this problem. User-ID is a feature that lets you pass your own unique, persistent identifier — most commonly the ID your website or app already assigns a visitor when they log into an account — into GA4 alongside the standard Client ID. Because that identifier is generated by your own system rather than tied to a browser cookie, it stays consistent regardless of which device or browser the same logged-in person uses. GA4 uses this to stitch sessions from multiple devices back together into a single, accurate user journey, and to produce a cross-device report that shows genuinely how users move between device categories on their way to converting.
Setting up User-ID requires a login system, and that's an important caveat. Because User-ID depends on your own application assigning a consistent identifier, it only works for visitors who actually log in — an anonymous visitor who never creates an account or signs in has no persistent ID to pass. This means User-ID coverage will always be partial for most consumer websites, covering your logged-in, returning audience far more completely than your anonymous, first-time visitors. That partial coverage is still valuable — it's simply important to interpret cross-device reports with that limitation in mind, rather than assuming they represent 100% of your total traffic.
The practical setup, at a high level. Implementing User-ID involves your development team passing a user_id parameter into the GA4 configuration whenever a user is authenticated, using a value from your own backend system (never anything like an email address or personally identifiable string directly, since GA4's terms explicitly prohibit sending personally identifiable information into standard parameters — an internal database ID or hashed identifier is the correct approach). Once implemented, GA4 begins associating events across devices under that shared ID automatically, and the Cross-device report, found under Reports → User → User attributes in most GA4 configurations (or via a dedicated cross-device exploration built in the Explore section), becomes populated with real data over time.
Google Signals as a complementary, no-code alternative. For properties without a login system, or as an addition even where one exists, GA4 offers Google Signals — a setting (found in Admin → Data Settings → Data Collection) that uses aggregated, anonymized data from users who are signed into their own Google Account and have enabled ad personalization, to help identify the same person across devices without requiring your own login system at all. Google Signals is meaningfully less precise than a proper User-ID implementation, since it depends entirely on Google's own signed-in user base and ad personalization settings, but it's a genuinely useful, low-effort addition that also unlocks demographic and interest reports that are otherwise unavailable in GA4. Turning it on is a five-minute task with no development work required, which makes it one of the easier wins in this entire module.
Why cross-device data changes how you should read a funnel. Once cross-device tracking is working, in whatever form, a pattern becomes visible in most industries that single-device tracking hides entirely: a meaningful share of conversions involve research on a phone followed by a purchase on a desktop or tablet, particularly for higher-consideration or higher-priced products. Without cross-device visibility, that phone session looks like a low-value visit that "didn't convert," which can lead a beginner to wrongly deprioritize mobile marketing spend that was, in reality, doing essential work earlier in the journey. This is one of the clearest, most concrete examples in all of analytics of why the metric you can see easily is not always the metric that reflects what's actually happening.
2. Campaign Tracking and UTM Parameters
2.1 Understanding Campaign Tracking
Campaign tracking is the practice of deliberately labeling the links you share — in ads, emails, social posts, and anywhere else you control the link — so that when someone clicks through and lands on your website, Google Analytics can record exactly which specific effort sent them, rather than lumping that visit into a generic, low-detail category.
To understand why this matters, it helps to understand what GA4 does without any deliberate tagging. Google Analytics uses default channel grouping, a set of automated rules that examine the referring domain and some basic URL signals to guess at a traffic source. This works reasonably well for a small number of cases — traffic from a Google organic search result is fairly reliably detected, for instance, because the referring domain itself makes it obvious. But it works poorly, or not at all, for a huge share of real-world marketing activity. A link shared inside the Instagram app, an email newsletter, a WhatsApp message, or a native mobile app carries little to no useful referrer information by the time it reaches your website, and GA4 has no way to distinguish "an organic Instagram post" from "a paid Instagram ad" from "a link in an Instagram DM" using referrer data alone — all of it risks landing in a vague bucket like Direct or Unassigned unless the link itself carries explicit tags.
This is the specific gap UTM parameters exist to close. By appending a small, standardized set of tags to the end of a URL, you tell Google Analytics explicitly — not through inference, but through direct declaration — exactly what source, medium, and campaign sent this specific visitor. Every UTM-tagged link you ever share becomes a small, deliberate data point rather than a guess GA4's automated system has to make on your behalf.
Campaign tracking versus conversion tracking — a distinction worth being precise about. Campaign tracking (this section's topic) is about correctly attributing where a visit came from. Conversion tracking, covered in Module 17, is about correctly recording what that visitor did once they arrived. The two are deeply connected but answer different questions — campaign tracking without conversion tracking tells you which campaigns drove traffic but not which drove results; conversion tracking without campaign tracking tells you results happened but not which specific effort deserves credit for them. A complete, trustworthy analytics setup needs both working correctly at the same time.
2.2 Creating UTM Parameters for Tracking Campaigns
A UTM parameter (Urchin Tracking Module parameter — the name is a legacy of Urchin, the analytics company Google acquired in 2005 to build what eventually became Google Analytics) is a specific key-value pair appended to a URL after a question mark, with additional parameters joined by an ampersand. There are five standard UTM parameters, and understanding exactly what each one is for — rather than treating them as interchangeable labels — is the difference between a campaign tracking system that produces clean, genuinely useful reports and one that quietly generates a mess.
utm_source — identifies the specific platform or publisher sending the traffic. This should answer "where, specifically, did this click happen?" Examples: newsletter, facebook, google, linkedin.
utm_medium — identifies the general category or channel type the traffic came through. This should answer "what kind of channel was this?" Examples: email, social, cpc (cost-per-click, i.e., paid search or paid social), organic, referral.
utm_campaign — identifies the specific campaign, promotion, or initiative the link belongs to, tying it to a real marketing effort with a clear name. Examples: summer_sale, product_launch_2026, weekly_newsletter_july8.
utm_term (optional) — historically used to record the specific paid search keyword that triggered an ad, most relevant in Google Ads contexts using manual tagging rather than auto-tagging.
utm_content (optional) — used to differentiate between multiple links or creative variations pointing to the same destination within the same campaign, which makes it especially valuable for A/B testing. Examples: banner_ad, text_link, button_cta, version_a versus version_b.
A complete example, assembled. Take a base URL of https://smartgentools.com/blog/module-18-analytics/. A fully tagged version promoting this exact article through a weekly email newsletter, with two different link placements being tested, might look like:
https://smartgentools.com/blog/module-18-analytics/?utm_source=newsletter&utm_medium=email&utm_campaign=weekly_digest_july8&utm_content=header_link
and, for the second placement in the same email:
https://smartgentools.com/blog/module-18-analytics/?utm_source=newsletter&utm_medium=email&utm_campaign=weekly_digest_july8&utm_content=footer_cta
Both links share the same source, medium, and campaign — correctly grouping them as part of the same overall effort — while utm_content cleanly separates their individual performance, letting you see directly in GA4 whether the header link or the footer call-to-action actually earned more clicks and conversions.
Naming convention rules that prevent your own data from fragmenting. UTM parameters are case-sensitive in Google Analytics, meaning Newsletter and newsletter will be recorded and reported as two entirely separate values, silently splitting a single channel's data into two rows in every report that includes it. The single most important discipline in this entire section is agreeing on — and consistently following — a small set of naming rules before you build a single link:
Use all lowercase for every parameter value, without exception, to eliminate the most common source of accidental fragmentation. Use underscores or hyphens instead of spaces, since raw spaces in a URL get encoded as %20 and become difficult to read in reports — pick one separator convention (this guide uses underscores) and apply it everywhere. Keep a shared reference list — even a simple spreadsheet — of the exact source and medium values your team has agreed to use, so that Instagram traffic is always tagged instagram, never inconsistently as Instagram, IG, or insta depending on who built the link that day. And never apply UTM tags to internal links — a link from one page of your own site to another page of your own site — because doing so overwrites the visitor's original session source data partway through their visit, effectively erasing the very attribution data you're trying to protect.
Building UTM links without manual errors. Typing UTM strings by hand is workable at very small volume, but errors compound quickly as the number of links, team members, and campaigns grows — a single misplaced character or inconsistent capitalization can quietly corrupt a report weeks later. A dedicated UTM link builder — a simple form where you enter your destination URL, source, medium, campaign, and optional term or content values, and receive a correctly formatted, properly encoded URL as output — removes nearly all of that risk, and is considered standard practice by essentially every working digital marketer rather than an optional convenience. SmartGen's own free UTM Link Builder tool exists for exactly this purpose, alongside the full suite of free tools referenced throughout this course.
2.3 Analysing Marketing Campaigns
Once UTM-tagged links are live and traffic starts arriving through them, GA4 gives you several ways to actually read that data — and, as with most of analytics, the value comes from knowing which report answers which specific question.
Traffic acquisition report. Found under Reports → Acquisition → Traffic acquisition, this is the primary report for reviewing campaign performance. The default view groups traffic by Session default channel group (an automated classification like Organic Search, Paid Social, Email, Referral), but the real power for UTM analysis comes from changing the primary dimension to Session campaign, Session source, Session source/medium, or Session source/medium/campaign, each of which lets you drill directly into the specific UTM values you've been tagging. Adding a secondary dimension — commonly Session content, when you want to compare creative variations within one campaign — lets you go a level deeper without leaving the report.
Reading the report against real business outcomes, not just traffic volume. A campaign that drove ten thousand sessions but zero meaningful engagement or conversions is not a successful campaign, regardless of how impressive the raw traffic number looks in isolation. Alongside session count, review engaged sessions, average engagement time, and — most importantly — conversions and total revenue, all of which can be added as columns or viewed by clicking into any individual campaign row. A smaller campaign with a strong conversion rate and healthy revenue per session is very often the better story to bring to a stakeholder than a larger one that only moved a top-line traffic number.
Building a comparison across campaigns. GA4's Explore section allows you to build a free-form table or chart specifically comparing multiple campaigns side by side — sessions, conversions, conversion rate, and revenue, each broken out by utm_campaign value — which is typically far more useful for a real reporting conversation than scrolling through the standard Traffic acquisition report row by row. Saving this as a reusable exploration means future campaign reviews take minutes rather than being rebuilt from scratch each time.
A word on attribution models. GA4 uses data-driven attribution by default for conversion credit, which distributes credit for a conversion across multiple touchpoints in a visitor's journey based on modeled contribution, rather than giving 100% of the credit to only the very last click before conversion (a simpler approach called last-click attribution, which GA4 still makes available as an alternative model for comparison, found under Advertising → Attribution → Model comparison). Understanding that your reports are, by default, already accounting for multi-touch journeys — rather than crediting only the final link someone clicked — matters directly for interpreting campaign data honestly, particularly for upper-funnel channels like social media and display advertising, which frequently introduce a customer early in their journey without being the final click that closes it.
🎯 Stop guessing where your traffic comes from.
Create precise tracking URLs for Google Analytics instantly. Use our free UTM campaign link builder to generate clean, error-free UTM codes for social media, email, and paid ads. Master your tracking strategy with our ultimate UTM guide.
Your data is never stored or shared. Read Privacy Policy
(If your site's editor strips embedded HTML, use this fallback link: Free UTM Campaign Link Builder → · We respect your data — read the Privacy Policy)
---A Mid-Guide Reality Check — The Habit That Actually Determines Whether Any of This Works
Everything covered in this module so far is, individually, straightforward. Reading a device breakdown report is not complicated. Filling in five fields on a UTM builder is not complicated. What actually determines whether cross-device and campaign data ends up useful six months from now is a much less glamorous factor: consistency, applied by everyone on a team, every single time a link goes out.
The single most common failure mode I see is not a lack of understanding — it's a UTM convention that's followed carefully for the first few campaigns and then quietly abandoned once things get busy, or followed correctly by one person on a team and inconsistently by everyone else. The result, months later, is a "Campaigns" report riddled with near-duplicate rows —
Summer_Sale,summer-sale,summersale— that all should have been the same campaign, and a genuine loss of trust in the data, because nobody can be quite sure the numbers in front of them are complete.The fix isn't more sophisticated tooling. It's a short, written naming convention document, a shared UTM builder everyone actually uses instead of typing links by hand, and a habit of spot-checking the Traffic acquisition report periodically for exactly the kind of near-duplicate fragmentation described above. This guidance draws on Google's own published Analytics and Ads documentation, alongside the practical patterns that consistently separate analytics setups that stay trustworthy over time from the ones that quietly degrade into noise.
3. Social Media and Advertising Analytics
3.1 Tracking Social Media Interactions
Social media platforms — covered in depth across Modules 4 through 8 of this course — each provide their own native analytics dashboard, and those platform-native numbers matter and should absolutely be reviewed on their own terms. But a platform's own dashboard can only ever tell you what happened on that platform: impressions, likes, shares, native engagement. It cannot, on its own, tell you what happened after someone left that platform and landed on your website — and for most businesses, that second half of the story is where the actual revenue lives.
This is where UTM-tagged social links, covered in Section 2, become directly essential. Every link you post to a social platform — whether it's an organic post, a bio link, or a paid ad — should carry UTM tags identifying the specific platform as utm_source (instagram, facebook, linkedin, tiktok, pinterest, x) and the correct utm_medium (social for organic posts, paid-social or cpc for paid campaigns, a distinction worth keeping consistent since conflating organic and paid social traffic in reporting hides exactly the comparison — organic reach versus paid spend — that most stakeholders actually want to see).
Reviewing social traffic quality inside GA4. Once tagged links are flowing in, the Traffic acquisition report (Section 2.3) becomes your primary tool for reviewing social performance from a website-outcomes perspective, filtered or grouped by the relevant utm_source values. Look specifically at engagement rate and conversions by platform — it's extremely common, across many industries, to see one platform driving high raw traffic volume with comparatively low engagement or conversion (frequently the case with traffic from viral or algorithm-boosted organic posts, which can bring in a large volume of casually curious visitors), while a different platform drives a smaller volume of far more qualified, higher-converting traffic. Neither pattern is inherently good or bad on its own — both are useful, different kinds of value — but only cross-referencing platform-native data with UTM-tagged GA4 data reveals the distinction at all.
Referral traffic as a supplementary, imperfect signal. For social shares and mentions you don't personally tag — a visitor sharing your article organically, or a link posted by someone else — GA4's referral traffic classification, visible in the Traffic acquisition report, can still surface some social platforms as a referring domain, though considerably less precisely than deliberate UTM tagging, and increasingly less reliably as more platforms restrict referrer data by default for privacy reasons. Treat referral data as a useful supplementary signal, never as a substitute for tagging the links you actually control.
3.2 Integrating Google Analytics with Google Ads
If your business runs paid advertising through Google Ads, linking that account to GA4 is one of the single highest-value setup steps covered anywhere in this course — and it's a setting, not a piece of code, which makes it considerably easier to get right than most of the technical work in earlier modules.
Why linking matters, specifically. Without a link between the two platforms, Google Ads and GA4 operate as two separate, disconnected sources of truth. Google Ads knows what you spent and how many clicks an ad received; GA4 knows what happened once a visitor arrived on your site. Linking the accounts brings both halves together: GA4 conversion events become available for import directly into Google Ads as conversion actions, meaning Google Ads can be optimized toward the outcomes you actually care about — completed purchases, form submissions, sign-ups — rather than only clicks. Simultaneously, cost, click, and impression data from Google Ads flows into GA4's Advertising reports, meaning you can finally see spend and on-site revenue in the same interface, which is the only way to calculate genuine return on ad spend without exporting data and stitching it together manually.
The setup process, step by step. From the GA4 Admin panel, navigate to Admin → Product Links → Google Ads Linking, click Link, choose the specific Google Ads account (you'll need appropriate admin access on both the GA4 property and the Ads account), and confirm the link. Once linked, enable auto-tagging inside Google Ads itself (Settings → Account settings → Auto-tagging), which automatically appends a gclid (Google Click Identifier) parameter to your ad URLs — a Google-managed alternative to manual UTM tagging specifically for Google Ads clicks, which passes richer, more reliable data than manual UTM tags would for this specific channel and is Google's own explicitly recommended approach for Ads traffic specifically. It's worth noting the practical implication here directly: for Google Ads specifically, auto-tagging via gclid is generally preferable to manually applying UTM parameters, since it captures additional data (like specific keyword and ad group information) automatically; manual UTM tagging remains the correct approach for every other channel — email, organic social, referral partnerships — where no equivalent auto-tagging system exists.
Importing GA4 conversions into Google Ads. After linking, navigate within Google Ads to Goals → Conversions → Summary, and use + New conversion action → Import → Google Analytics 4 properties to select which specific GA4 conversion events (covered in Module 17) should be imported as Google Ads conversion actions. This step is what actually allows Google Ads' automated bidding strategies — Target CPA, Target ROAS, Maximize Conversions — to optimize toward real, meaningful business outcomes rather than toward clicks or generic on-site activity alone.
Enabling audience sharing. A properly linked account also allows GA4 audiences — for instance, visitors who viewed a specific product but didn't purchase — to be shared directly into Google Ads for remarketing campaigns, without needing a separate remarketing tag maintained independently on your website. This single integration point removes a meaningful amount of duplicate technical setup that many beginners don't realize is unnecessary once GA4 and Ads are properly linked.
3.3 Measuring Ad Performance
With linking complete and conversions importing correctly, the final piece is knowing which specific numbers actually indicate whether an ad campaign is working — a glossary that applies not just to Google Ads but, with minor naming variations, to paid social platforms as well.
Click-Through Rate (CTR) — the percentage of people who saw your ad and clicked it, calculated as clicks divided by impressions. CTR is primarily a signal of how compelling your ad creative and targeting are to the audience seeing it; a low CTR relative to your industry's typical range often points to a mismatch between your ad and the audience it's being shown to, rather than a pricing or product problem.
Cost Per Click (CPC) — the average amount you pay each time someone clicks your ad. CPC is driven by competition for your specific targeting (keywords, audience, placement) and by your own ad quality — platforms including Google Ads reward more relevant, higher-quality ads with lower costs per click, which is why improving ad relevance is simultaneously a performance strategy and a cost-control strategy.
Cost Per Mille (CPM) — the cost per one thousand impressions, most relevant for brand awareness campaigns where the goal is being seen by as many relevant people as possible, rather than earning direct clicks.
Conversion Rate — the percentage of clicks (or sessions, once someone lands on your site) that result in a completed conversion event. This is where the GA4-to-Ads linking work from Section 3.2 becomes essential — without accurate, imported conversion data, Google Ads can only ever report on clicks, never on what those clicks actually accomplished.
Cost Per Acquisition (CPA), also called Cost Per Action — the total amount spent divided by the number of conversions achieved, telling you directly what it actually costs, in real currency, to generate one meaningful outcome. CPA is one of the most directly actionable numbers in all of paid advertising, because it can be compared directly against the actual value of that outcome to your business.
Return on Ad Spend (ROAS) — total revenue generated divided by total ad spend, typically expressed as a ratio (a ROAS of 4.0, or "4:1," means four currency units of revenue for every one unit spent on ads). ROAS is the metric most directly tied to profitability, and it's only calculable at all once GA4's revenue and conversion data is flowing correctly into Google Ads through the linking process described in Section 3.2 — which is, ultimately, the entire practical payoff this module has been building toward across every prior section.
Reading these metrics together, not in isolation. A campaign with an excellent CTR and low CPC can still be a poor investment if its conversion rate is weak and its resulting CPA is higher than the value of the customers it brings in — and conversely, a campaign with a mediocre CTR can be genuinely excellent if the clicks it does earn convert at an unusually high rate and produce a strong ROAS. This is the core discipline this entire module has been building toward: reading connected numbers together, across platforms that only actually connect once mobile and cross-device tracking, UTM discipline, and GA4-to-Ads linking are all correctly in place.
Visual Summary
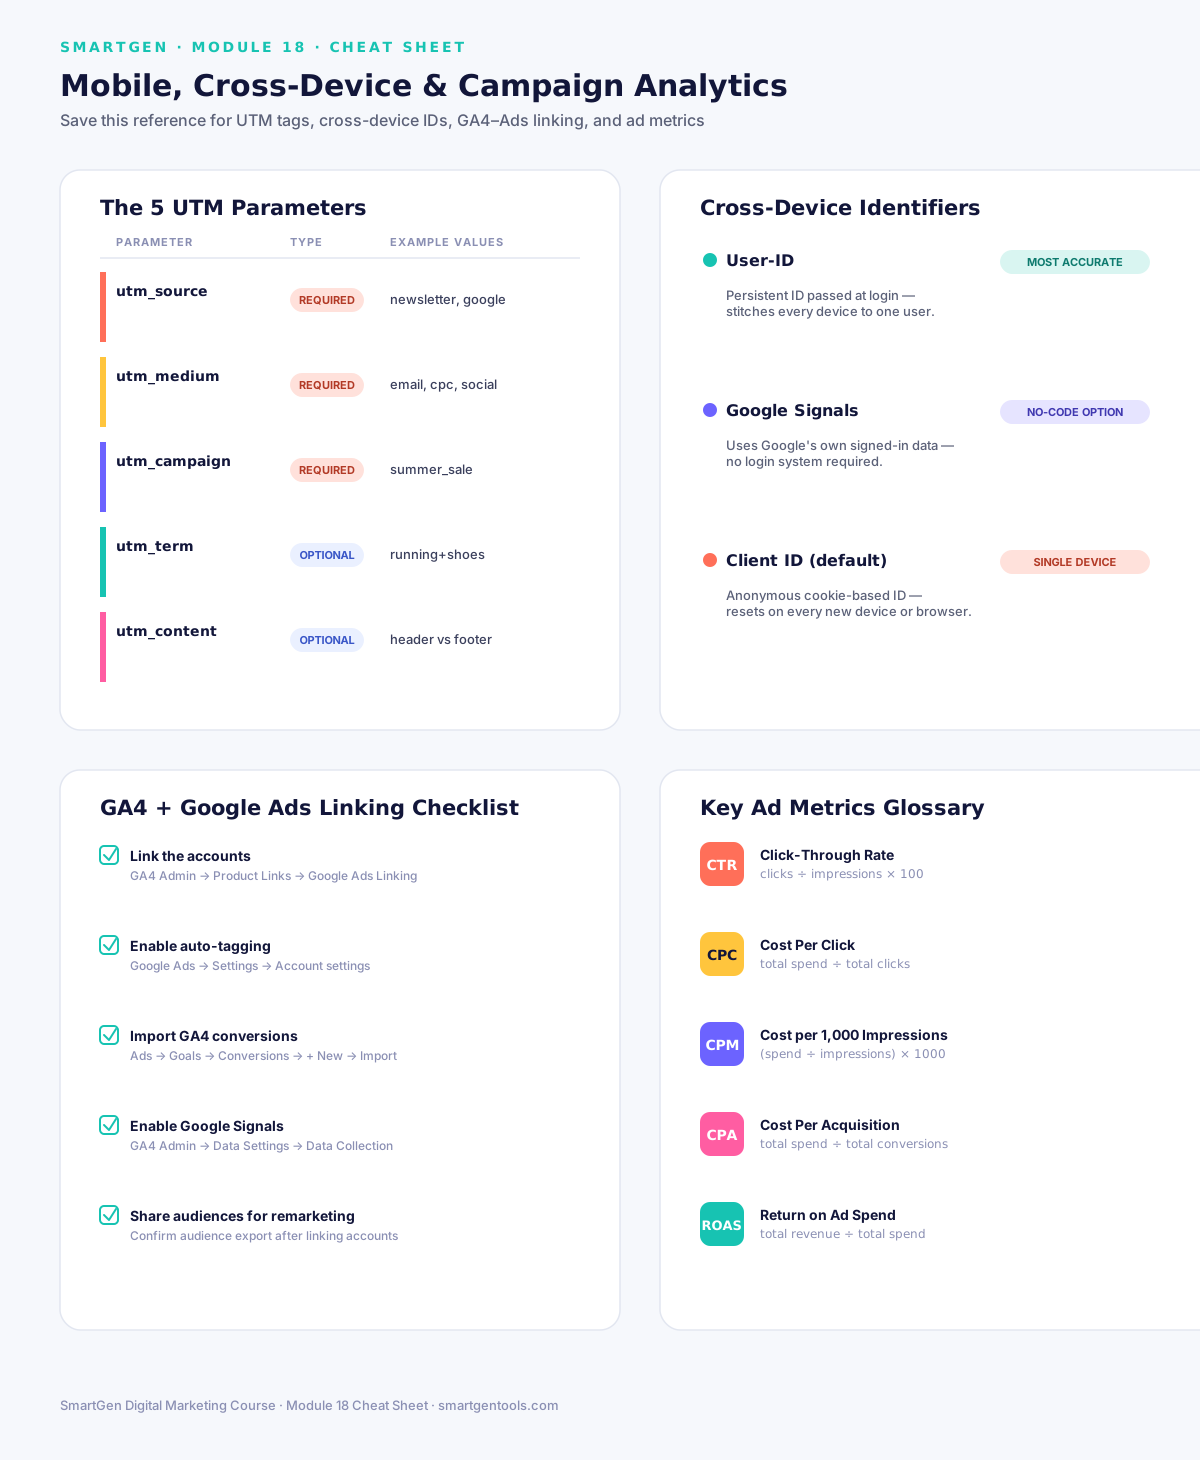
Below are two original visual assets built specifically for this module. The first maps the complete framework covered across all three sections — mobile and cross-device tracking, campaign and UTM tracking, and social and advertising analytics. The second is a quick-reference cheat sheet covering the five UTM parameters, cross-device identifiers, the GA4–Google Ads linking checklist, and the core ad performance metrics glossary, suitable for saving or printing as an ongoing desk reference.
Module 18 Mega Guide Summary
In this module, we covered why mobile-first measurement is no longer optional, given how much of most audiences' behavior now happens on a phone, and how responsive design decisions should be informed directly by your own Tech Overview data rather than generic assumed breakpoints. We covered cross-device tracking in depth — why the default Client ID approach fragments a single real customer into multiple disconnected users, how User-ID solves this using your own login system, and how Google Signals offers a lighter-weight, no-code alternative. We covered campaign tracking and UTM parameters comprehensively: what each of the five standard parameters actually means, how to build them without the naming inconsistencies that quietly fragment your own reports, and how to read campaign performance through the Traffic acquisition report and GA4's Explore section rather than raw traffic volume alone. And we closed with social and advertising analytics — tagging social links correctly, the full step-by-step process for linking Google Analytics with Google Ads, and the complete glossary of ad performance metrics, from CTR through ROAS, that only become genuinely meaningful once every earlier piece of this module is correctly in place.
Practice exercise: Pick one live page on your own website or a client's, and use a UTM link builder to create three tagged versions of the same URL — one for an email campaign, one for an organic social post, and one for a paid social ad — following the naming convention rules from Section 2.2 exactly. Then open your GA4 property's Traffic acquisition report, set the primary dimension to Session source/medium, and confirm you can find historical data structured the same way. If your existing reports show inconsistent capitalization or near-duplicate source values, that's this module's core lesson showing up directly in your own data — and exactly the kind of cleanup worth doing before your next campaign goes live.
Frequently Asked Questions
What's the actual difference between a UTM parameter and a gclid parameter?
A UTM parameter is a manually defined tag you create yourself to label any link, on any platform. A gclid (Google Click Identifier) is a parameter Google Ads generates and appends automatically through auto-tagging, specifically for clicks originating from Google Ads, and it carries richer, platform-verified data than a manual UTM tag would for that specific channel. Use auto-tagging and gclid for Google Ads traffic specifically, and manual UTM parameters for every other channel you tag yourself.
Will adding UTM parameters to my URLs hurt my SEO rankings?
No. Search engines are entirely capable of recognizing UTM parameters as tracking parameters rather than a genuinely different page, and they do not create duplicate content issues or ranking penalties. The one rule worth following carefully, covered in Module 10 and reinforced here, is to never apply UTM tags to internal links between your own pages — that guidance is about protecting your own analytics data integrity, not an SEO concern.
Do I need User-ID tracking if my website doesn't have user accounts or logins?
Traditional User-ID specifically requires a login system to generate a persistent identifier, so it isn't available in that form without one. Google Signals, covered in Section 1.2, is the practical alternative for sites without logins, offering a lighter, no-code form of cross-device insight by using Google's own signed-in user data instead of your own.
How long does it take for Google Ads conversion data to appear correctly in GA4 after linking the accounts?
The link itself typically activates within a few hours, but meaningful, statistically useful conversion data generally takes one to two full weeks to accumulate, particularly for lower-volume campaigns, since both platforms need enough real conversion events to populate reports and, where relevant, allow automated bidding strategies to begin optimizing effectively.
What's a healthy ROAS to aim for?
There is no universal number — a healthy ROAS depends entirely on your specific profit margins, average order value, and customer lifetime value, and what looks like an excellent ROAS in a high-margin service business can be a losing number in a low-margin retail category. Rather than chasing a generic industry benchmark, calculate the minimum ROAS your own margins require to be profitable, and treat that calculated number as your real baseline for evaluating any campaign.
— Written by Sayad Md Bayezid Hosan for the SmartGen blog
 ✓
✓
Sayad Md Bayezid Hosan
Founder & Tech Entrepreneur | Full-Stack Developer
Full-stack Web Developer, Digital Marketing Strategist, and Tech Entrepreneur with 5+ years of experience delivering innovative digital solutions. Specializing in web development, AI integration, strategic digital marketing, and tech entrepreneurship. As a leading Tech Provider, I help audiences navigate digital platforms safely through permission-based technical solutions and digital business asset management.
Credentials & Expertise:
- Founder of CWB Agency & GenZFrontier
- Final-year English Student at Northern University Bangladesh
- Specialized in AI-powered web development & content strategy
- Published author on tech, digital marketing & entrepreneurship
What's Next?
In the next module, we'll continue building on this analytics and measurement series. Take a moment to revisit the earlier lessons in this course if you need a refresher, since each module builds on what came before it:
- Introduction to Online Digital Marketing: A Beginner's Guide
- Module 3: Social Media Marketing (SMM) — Advertising Concepts and Platform Selection
- Module 4: Meta (Facebook) Marketing — The Complete A to Z Mega Guide
- Module 5: Instagram Marketing — The Complete A to Z Mega Guide
- Module 6: X (Formerly Twitter) Marketing — The Complete A to Z Mega Guide
- Module 7: LinkedIn Marketing — The Complete A to Z Mega Guide
- Module 8: Pinterest Marketing — The Complete A to Z Mega Guide
- Module 9: Creating a WordPress Website — The Complete A to Z Mega Guide
- Module 10: Search Engine Optimization (SEO) — The Complete A to Z Mega Guide
- Module 11: Off-Page Optimization — The Complete A to Z Mega Guide
- A Complete Guide to Automated Sitemap Management for Modern SEO
- Module 13: Algorithm Updates and Analysis — The Complete A to Z Mega Guide
- Module 14: Technical SEO Optimization — The Complete A to Z Mega Guide
- Module 15: Video Marketing Through YouTube — The Complete A to Z Mega Guide
- Module 16: Email Marketing — The Complete A to Z Mega Guide
- Google Web Analytics — The Complete A to Z Mega Guide for Beginners
This article was written by Sayad Md Bayezid Hosan for the SmartGen blog. For free tools to support your digital marketing journey, visit smartgentools.com.
SmartGen · Digital Marketing · Digital Marketing Course · Module 18 · Cross-Device Tracking · UTM Parameters · Campaign Tracking · GA4 Google Ads Integration