
July 10, 2026 • General • By Sayad Md Bayezid Hosan
MODULE 17: Google Web Analytics — The Complete A to Z Mega Guide for Beginners
A complete, beginner-friendly A to Z guide to Google Analytics (GA4) — what web analytics actually is and why it matters, how to navigate the Google Analytics interface without feeling lost, the core metrics every marketer needs to understand, and how to use advanced reporting, segments, and secondary dimensions to find insights the basic reports never show you.
👉 
Welcome to Module 17: Google Web Analytics
Think back across everything this course has covered so far. You've built a real website (Module 9). You've learned how search engines rank it (Module 10) and how to research the right keywords (Module 11). You've learned to protect it from algorithm penalties (Module 13), tighten its technical health (Module 14), grow it through YouTube (Module 15) and email (Module 16). Every one of those modules produces activity — pages published, videos uploaded, emails sent.
This module answers the one question none of that activity can answer on its own: is any of it actually working?
Google Analytics is how you find out. It's a free tool that quietly watches what real visitors do on your website — where they came from, what they read, how long they stayed, and whether they ever did the thing you actually wanted them to do — and turns all of that into numbers you can act on. Without it, you're building your entire marketing strategy on guesses. With it, every module in this course becomes measurable, which means every module in this course becomes improvable.
I'm going to take this slowly and plainly, because the Google Analytics interface has a well-earned reputation for overwhelming beginners the first time they open it. By the end of this guide, that same interface should feel like a familiar, useful tool instead of a wall of confusing numbers.
Before diving in, here are all the earlier lessons in this course — I'd recommend working through them in order if you haven't already, since each one builds on what came before it:
- Introduction to Online Digital Marketing: A Beginner's Guide
- Module 3: Social Media Marketing (SMM) — Advertising Concepts and Platform Selection
- Module 4: Meta (Facebook) Marketing — The Complete A to Z Mega Guide
- Module 5: Instagram Marketing — The Complete A to Z Mega Guide
- Module 6: X (Formerly Twitter) Marketing — The Complete A to Z Mega Guide
- Module 7: LinkedIn Marketing — The Complete A to Z Mega Guide
- Module 8: Pinterest Marketing — The Complete A to Z Mega Guide
- Module 9: Creating a WordPress Website — The Complete A to Z Mega Guide
- Module 10: Search Engine Optimization (SEO) — The Complete A to Z Mega Guide
- Module 11: Off-Page Optimization — The Complete A to Z Mega Guide
- A Complete Guide to Automated Sitemap Management for Modern SEO
- Module 13: Algorithm Updates and Analysis — The Complete A to Z Mega Guide
- Module 14: Technical SEO Optimization — The Complete A to Z Mega Guide
- Module 15: Video Marketing Through YouTube — The Complete A to Z Mega Guide
- Module 16: Email Marketing — The Complete A to Z Mega Guide
Why I'm Writing This Guide the Way I Am
Most people's first experience with Google Analytics goes the same way: they log in, see a dashboard packed with unfamiliar words and a sidebar full of sections they've never heard of, and quietly close the tab, telling themselves they'll "figure it out later." Later rarely comes, and the tool that was supposed to answer their biggest questions ends up gathering digital dust.
This guide is built to prevent exactly that. Instead of dumping every feature on you at once, we're going to walk the interface the way you'd actually walk it as a beginner — starting with the handful of screens you'll genuinely use every week, understanding a small set of core metrics deeply rather than a huge list shallowly, and only then moving into the more advanced reporting tools once the fundamentals feel comfortable. Nothing here requires a technical background. If you can read a simple chart, you can learn this.
1. Introduction to Web Analytics
What Web Analytics Actually Is
Web analytics is the practice of collecting, measuring, and studying data about how people use a website, in order to understand their behavior and make better decisions. Every time someone visits your WordPress site — reads a blog post, clicks a link, fills out a form, or leaves after five seconds — that's a small piece of behavior that web analytics tools capture and turn into something you can actually learn from.
Google Analytics is, by a wide margin, the most widely used web analytics platform in the world, and it's completely free. The current version, called GA4 (Google Analytics 4), replaced the older version — known as Universal Analytics — which stopped collecting new data in mid-2023. If you ever come across an older tutorial describing a different-looking interface with terms like "Goals" or "Bounce Rate" calculated differently than what's described in this guide, that's very likely describing the old Universal Analytics system. Everything in this module reflects GA4, since that's what you'll actually be using today.
Why This Matters for Everything Else in This Course
Here's the honest truth: every single earlier module in this course produces something that can work, but none of them can tell you, on their own, whether it actually is working for your specific website and audience. Did that Pinterest strategy from Module 8 really send people to your site? Did the email campaign from Module 16 actually get people to read your latest guide? Did your SEO work from Module 10 translate into real human visitors, or just impressive-looking keyword rankings that nobody ever clicks? Google Analytics is the tool that answers every one of those questions with real evidence instead of hopeful assumptions.
The Big Idea Behind GA4: Everything Is an "Event"
One thing worth understanding early, because it makes the rest of this module click into place: GA4 is built around a single core idea called event-based data. Instead of just recording "a page was viewed" as a special, separate type of data point, GA4 treats almost everything a visitor does — viewing a page, scrolling down, clicking a button, submitting a form, watching a video, making a purchase — as an event. Some events (like page_view and session_start) are collected automatically the moment you set things up. Others (like tracking clicks on a specific "Download" button) can be set up manually for the exact actions that matter most to your business. This flexible, everything-is-an-event design is also why GA4 works equally well for websites and mobile apps inside the same system.
Getting Set Up: The Basics
Setting up Google Analytics on your WordPress site (from Module 9) generally involves three steps: creating a free Google Analytics account and a "property" for your specific website, receiving a small tracking snippet (called the Google tag) unique to that property, and adding that snippet to your site so it can start collecting data — most commonly through a dedicated WordPress analytics plugin, or through Google Tag Manager for more advanced, flexible tracking setups. Once installed, data typically begins appearing within a day, and GA4 will keep collecting it continuously from that point forward.
2. Navigating the Google Analytics Interface
This is where most beginners feel lost — and reasonably so, since GA4's interface groups a huge amount of functionality into a fairly compact sidebar. Let's walk through exactly what you're looking at, one piece at a time.
👉 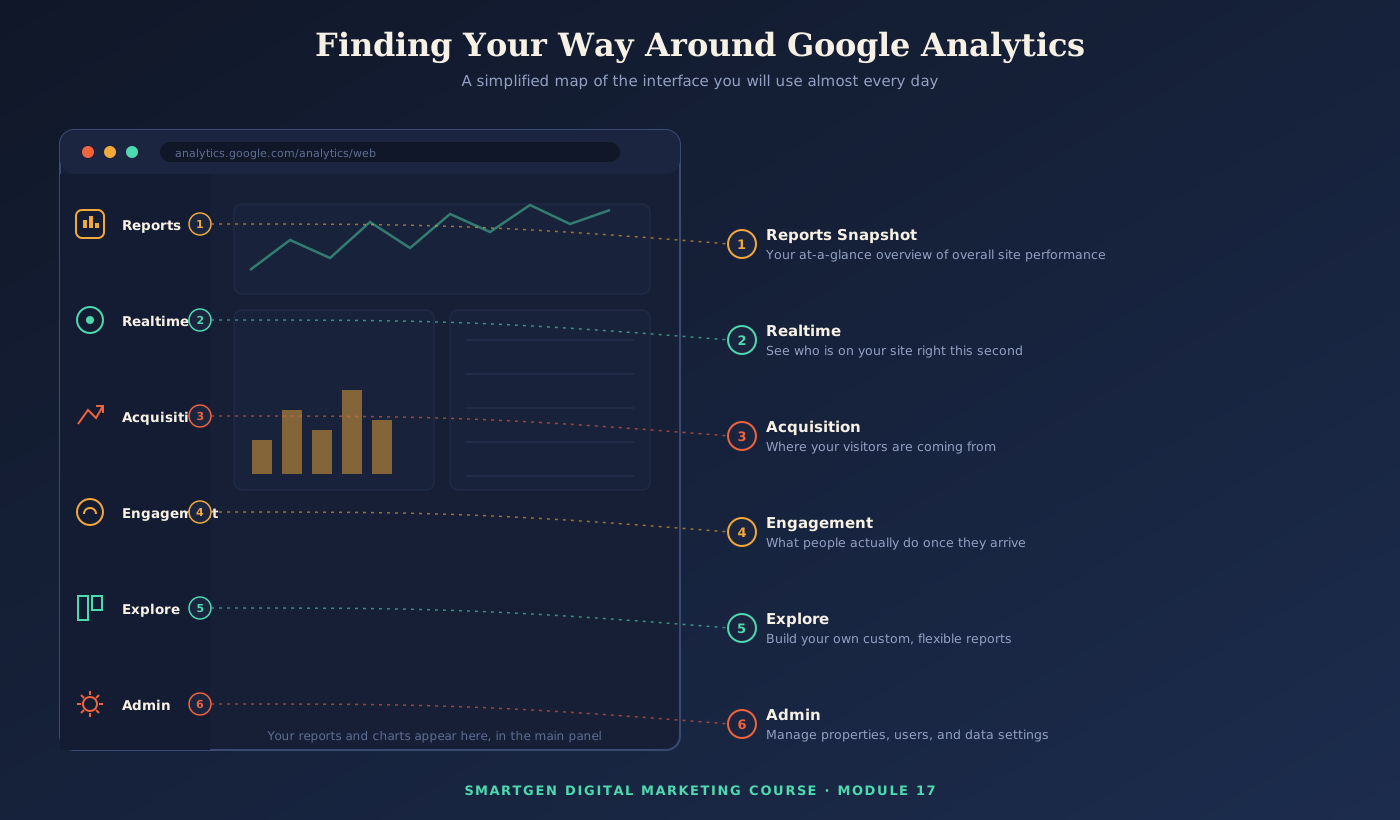
Reports Snapshot — Your Home Base
This is usually the first screen you'll see, and it's designed as a quick, at-a-glance summary of your site's overall health: users, sessions, top traffic sources, and top pages, all in one place. Think of it as the front page of a newspaper — a summary of the biggest headlines, with the full stories available if you want to click deeper into any one of them.
Realtime — What's Happening Right Now
The Realtime report shows you who is on your site in this exact moment — how many active users, what pages they're viewing, and where they came from, updating continuously. It's genuinely useful for one specific purpose: confirming that something just worked. Published a new post and shared it on social media? Open Realtime and watch the visits arrive within seconds, confirming your tracking and your promotion both worked correctly.
Acquisition — Where Your Visitors Come From
This is one of the two sections you'll return to constantly. Acquisition reports break down exactly where your traffic originated — organic search, social media, direct visits, referrals from other sites, email, and paid advertising. We'll go much deeper into how to actually read this in Section 3.
Engagement — What People Do Once They Arrive
The other section you'll use constantly. Engagement reports show you which specific pages and events people interacted with, how long they stayed, and how deeply they explored your site — the direct evidence of whether your content (Module 12) is genuinely holding attention once someone arrives.
Explore — Your Custom Report Builder
Beyond the pre-built reports, Explore is where you build your own tailored analysis for questions the standard reports weren't specifically designed to answer. This is genuinely more advanced territory, and it's exactly what Section 4 of this module is dedicated to.
Admin — Where Everything Gets Configured
The Admin section (usually a small gear icon) is where you manage the technical backbone of your analytics setup: your properties, your data streams, user access permissions, and — importantly — where you'll go to define conversion tracking, which we'll cover in Section 3.
A Practical Starting Habit
If you take away one thing from this section: don't try to learn every corner of the interface on day one. Start with Reports Snapshot and Acquisition. Check them weekly. Once those feel comfortable and familiar, expand into Engagement, and only then into Explore. This mirrors the same "start small, build consistently" principle that's shown up throughout this entire course, from Pinterest boards to blog publishing schedules.
3. Understanding Key Metrics
Numbers without context are just noise. This section covers the handful of metrics that matter most, what each one genuinely tells you, and — just as importantly — where each one can quietly mislead you if you take it too literally.
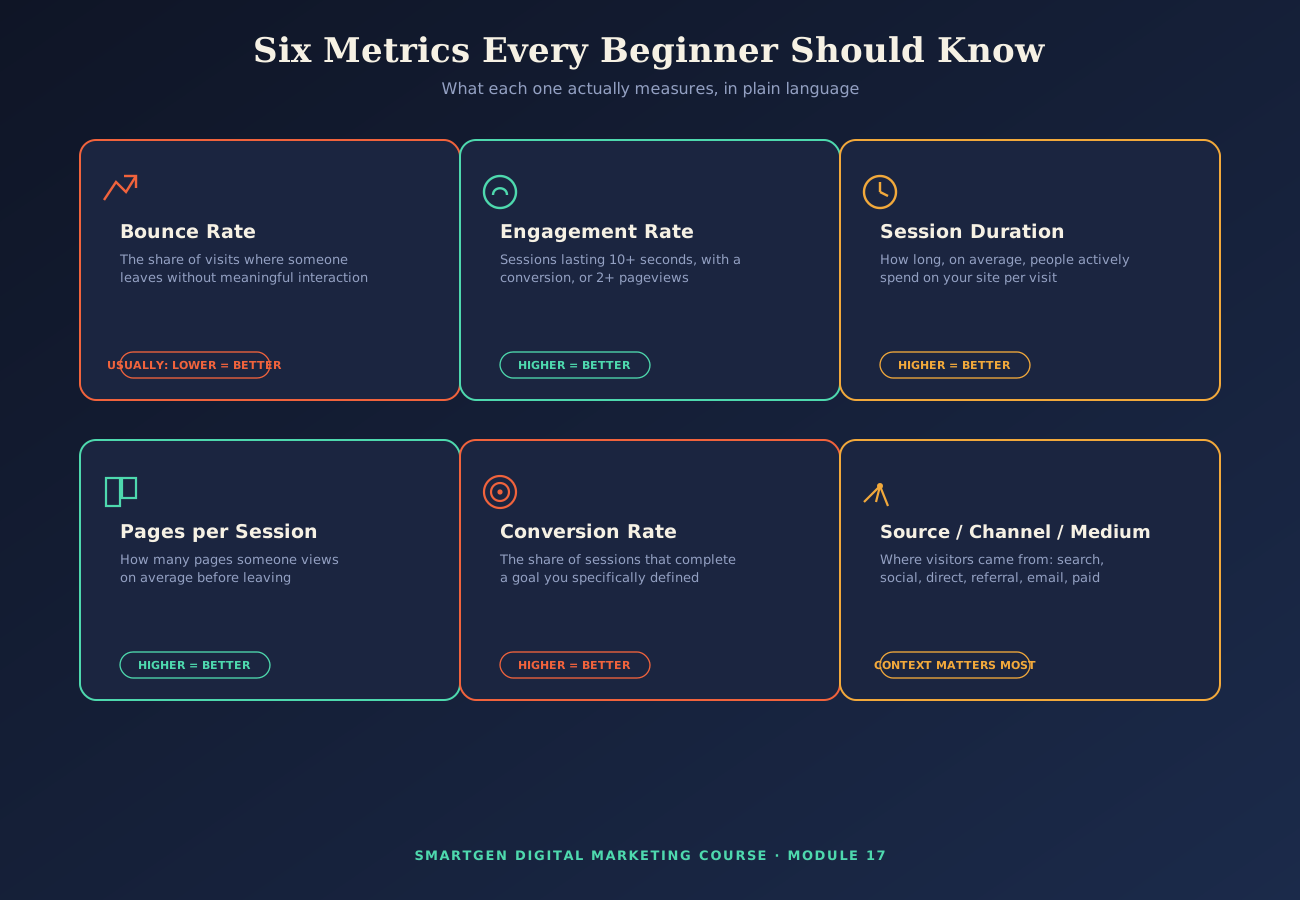
Bounce Rate, Session Duration, and Pages per Session
Bounce rate, in GA4 specifically, works a little differently than many beginners expect if they've read older tutorials. GA4 built its metrics around the idea of an engaged session — a visit that lasted at least 10 seconds, included a conversion, or included two or more page or screen views. Bounce rate in GA4 is simply the opposite of that: the percentage of sessions that were not engaged. In other words, Bounce Rate and Engagement Rate always add up to 100% of your sessions between them.
Session duration (shown in GA4 as average engagement time) tells you how long, on average, people were actively interacting with your site during a visit — not just how long a browser tab happened to stay open in the background.
Pages per session tells you how many pages, on average, someone views before their session ends.
Here's the genuinely important nuance beginners miss: a high bounce rate is not automatically bad, and a low bounce rate is not automatically good. Imagine someone searches a very specific question, lands on one thorough blog post from your site (built using the writing principles from Module 12), gets a complete answer within 45 seconds, and leaves satisfied. That visit might count as "not engaged" by GA4's technical definition if it didn't hit the 10-second-plus-interaction threshold in the right way, or it might simply be a single-page, short visit — and yet it was a complete success for that reader. Always read these three metrics together, and always ask what a "good" visit should actually look like for that specific page's purpose, rather than chasing low bounce rates as a goal in themselves.
Conversion Rate and Conversion Tracking
A conversion — which GA4 now calls a key event — is any specific action you've decided matters enough to track and count as a genuine business outcome: a newsletter sign-up, a contact form submission, a product purchase, a PDF download, or anything else meaningful to your specific goals.
Setting this up involves two steps: first, make sure the underlying event is actually being tracked (some, like purchases on an e-commerce site, are tracked automatically; others, like a specific button click, need to be set up as a custom event), and second, go into GA4's Admin section and mark that specific event as a key event, which tells GA4 to treat it as a genuine conversion in your reports going forward.
Conversion rate is simply the percentage of sessions (or users) that resulted in at least one key event. This is, for most businesses, more important than almost any other single metric in this module, because it directly measures whether your traffic is actually accomplishing something — echoing the exact same principle the Pinterest module (Module 8) applied to outbound clicks and the content marketing module (Module 12) applied to real conversions over raw pageviews.
Traffic Sources, Channels, and Mediums
This is where Google Analytics closes the loop on nearly every other module in this course, so it's worth understanding these three related terms precisely.
Source is the specific origin of a visit — google, facebook.com, newsletter, or a specific referring website's domain.
Medium is the general category describing how that traffic arrived — organic (unpaid search), cpc (paid clicks), referral (a link from another website), email, or social.
Channel is a broader, automatically-generated grouping that GA4 builds by combining source and medium information — categories like Organic Search, Paid Search, Direct, Referral, Organic Social, Paid Social, and Email, giving you a quick, high-level view before drilling into specifics.
For campaigns you run yourself — a specific email newsletter, a specific social post, a paid ad — you can add UTM parameters (small tags appended to a URL) so that traffic from that exact campaign shows up clearly and distinctly in your reports, rather than being lumped generically into "referral" or "direct." This is genuinely one of the most valuable habits you can build: it's the only reliable way to know, with real evidence, whether that specific Instagram post (Module 5) or that specific email send (Module 16) actually drove real visits and real conversions — rather than just hoping it did.
👉 
A Mid-Guide Reality Check — What I Actually Want You to Walk Away Understanding
We've now covered the fundamentals — the interface, and the metrics that matter most. Before moving into more advanced territory, it's worth naming the mistake that trips up beginners even after they've technically learned all of the above.
The mistake is treating every metric as a universal scoreboard, checked the same way for every single page, with no thought to what that specific page was actually supposed to accomplish. A long, comprehensive pillar guide (the kind Module 12 described) should show a longer session duration and more pages per session than a short, single-answer blog post — and that's not a problem to fix, it's simply two different pages doing two different jobs well. The real skill in analytics isn't memorizing what a "good" bounce rate or conversion rate looks like in the abstract; it's asking, for each specific page or campaign, "what did I actually want a visitor to do here, and does the data show that happening?"
The other thing worth naming clearly, heading into the final section: everything covered so far uses Google Analytics' pre-built reports, which are genuinely excellent for common, broad questions. But the moment your question gets more specific — "did visitors from Pinterest who read my WordPress guide convert at a different rate than visitors from email?" — the pre-built reports run out of room to answer you. That's exactly what the advanced tools in Section 4 exist to solve.
4. Advanced Reporting and Segmentation
Everything up to this point works well for broad, general questions. This section is for the sharper, more specific questions that only come up once you're genuinely comfortable with the fundamentals — and it's where Google Analytics stops being a dashboard you check and starts being a real research tool you actively use.
Custom Reports and Dashboards
The Explore section, introduced in Section 2, is where GA4's pre-built reports give way to fully custom analysis. Inside Explore, you'll find several distinct techniques, each suited to a different kind of question: Free Form exploration lets you freely combine any dimensions and metrics into your own table or chart, similar to building a simple pivot table. Funnel exploration lets you define a specific multi-step sequence (for example: Landing Page → Product Page → Add to Cart → Purchase) and see exactly what percentage of visitors make it through each step, and precisely where the biggest drop-offs happen. Path exploration shows you the actual sequences of pages and events people follow through your site, revealing common (and sometimes surprising) real-world browsing patterns. Once you've built an exploration that answers a question you'll want to revisit regularly, you can save it — effectively creating your own custom, reusable dashboard tailored specifically to your business, rather than relying only on Google's general-purpose defaults.
Creating and Using Advanced Segments
A segment is a defined slice of your data — a specific subset of users or sessions that share something in common — that you can isolate and study on its own, or compare directly against another segment. Inside Explore, you build a segment by setting conditions based on dimensions, metrics, or specific events: for example, "sessions where the traffic source was Pinterest," "users who completed a key event," or "visitors on mobile devices from a specific country."
Segments become genuinely powerful the moment you start comparing them side by side. A practical, realistic example: build one segment for "new users from organic search" and another for "returning users who arrived via email," then compare their engagement rate and conversion rate directly against each other. This kind of comparison routinely reveals things the overall, blended numbers hide completely — for instance, discovering that a smaller channel is quietly sending you your most loyal, highest-converting visitors, even though it doesn't produce the most total traffic.
Using Secondary Dimensions for Deeper Insights
Most standard GA4 reports show data broken down by a single dimension — a single way of categorizing your data, like Country, Device Category, or Session Source. A secondary dimension lets you add a second layer of breakdown directly into that same report, splitting each row further by a second category.
Here's a concrete, genuinely useful example: open your Traffic Acquisition report (organized by Session Source/Medium), then add Landing Page as a secondary dimension. Instead of just seeing "Organic Search sent you 500 sessions," you'll now see exactly which specific pages those 500 organic sessions actually landed on — instantly revealing which of your keyword-optimized pages from Module 11 are the ones genuinely earning search traffic. Another useful pairing: take a report broken down by Country, and add Device Category as a secondary dimension, to see whether visitors in a specific region behave differently on mobile versus desktop.
A simple habit worth building: whenever a single-dimension report answers "what" happened, ask yourself what a good follow-up "why" question would be — and then add the secondary dimension that would actually answer it, rather than staring at the same flat number and guessing.
Module 17 Mega Guide Summary
In this module, we covered what web analytics actually is and why Google Analytics (GA4) sits at the center of measuring everything else in this course, how to navigate the GA4 interface without feeling overwhelmed — starting with Reports Snapshot and Acquisition before expanding further, the core metrics that matter most (bounce rate, engagement rate, session duration, pages per session, conversion rate and key events, and traffic sources, channels, and mediums) along with the important context each one needs to be read correctly, and how to move beyond the pre-built reports using Explore's custom techniques, advanced segments, and secondary dimensions to answer sharper, more specific questions about your real audience.
Practice exercise: If you haven't already, connect Google Analytics to the WordPress site you built in Module 9. Once data starts flowing (even just a few days' worth is enough to start), open the Acquisition report and identify your top traffic source. Then add Landing Page as a secondary dimension to that same report, and note which specific page is earning the most visits from that source — that page is your current best-performing asset, and a strong candidate for the kind of content-cluster expansion described back in Module 12.
Frequently Asked Questions
Do I need to know how to code to use Google Analytics?
No. Installing the initial tracking tag typically takes a simple WordPress plugin or a short Google Tag Manager setup, both covered at a beginner level in Module 9, and everything covered in this module — reports, segments, secondary dimensions — is done entirely through GA4's visual interface with no coding required.
How long until I have enough data to draw real conclusions?
For overall traffic and traffic-source trends, a few weeks of data is usually enough to start spotting real patterns. For conversion rate and more specific segment comparisons, it's worth waiting for a larger sample — generally at least a month, and longer for lower-traffic sites — before treating small percentage differences as meaningful rather than random noise.
What's the difference between Users and Sessions?
A user represents one actual person (or more precisely, one browser/device identified over time); a session represents one single visit by that person. One user can generate several sessions if they visit your site multiple times, so sessions will always be equal to or greater than users over the same period.
Is Google Analytics free for a small business?
Yes — the standard version of Google Analytics used throughout this module is completely free, with generous enough limits that the overwhelming majority of small and medium-sized businesses never need to consider Google's separate paid enterprise tier.
My numbers look different in Google Analytics than in my WordPress plugin's built-in stats. Which one is right?
This is common and usually isn't a sign anything is broken — different tools measure visits differently (how they handle bots, caching, and repeat visits, for instance), so small discrepancies between tools are normal. For consistency, pick one platform as your primary source of truth — Google Analytics is the industry standard used throughout this module — and use it consistently when comparing performance over time.
Should I be worried about privacy and data regulations when using Google Analytics?
It's worth being aware that Google Analytics does collect visitor data, and depending on your audience's location, you may have legal obligations around cookie consent and privacy disclosures. This is a genuinely important area, but it's also a legal compliance topic rather than a technical analytics one, so if it applies meaningfully to your business, it's worth reviewing your specific obligations directly rather than relying on general guidance.
— Written by Sayad Md Bayezid Hosan for the SmartGen blog
 ✓
✓
Sayad Md Bayezid Hosan
Founder & Tech Entrepreneur | Full-Stack Developer
Full-stack Web Developer, Digital Marketing Strategist, and Tech Entrepreneur with 5+ years of experience delivering innovative digital solutions. Specializing in web development, AI integration, strategic digital marketing, and tech entrepreneurship. As a leading Tech Provider, I help audiences navigate digital platforms safely through permission-based technical solutions and digital business asset management.
Credentials & Expertise:
- Founder of CWB Agency & GenZFrontier
- Final-year English Student at Northern University Bangladesh
- Specialized in AI-powered web development & content strategy
- Published author on tech, digital marketing & entrepreneurship
What's Next?
In the next module, we'll continue building on this measurement foundation. Take a moment to revisit the earlier lessons in this course if you need a refresher, since each module builds on what came before it:
- Introduction to Online Digital Marketing: A Beginner's Guide
- Module 3: Social Media Marketing (SMM) — Advertising Concepts and Platform Selection
- Module 4: Meta (Facebook) Marketing — The Complete A to Z Mega Guide
- Module 5: Instagram Marketing — The Complete A to Z Mega Guide
- Module 6: X (Formerly Twitter) Marketing — The Complete A to Z Mega Guide
- Module 7: LinkedIn Marketing — The Complete A to Z Mega Guide
- Module 8: Pinterest Marketing — The Complete A to Z Mega Guide
- Module 9: Creating a WordPress Website — The Complete A to Z Mega Guide
- Module 10: Search Engine Optimization (SEO) — The Complete A to Z Mega Guide
- Module 11: Off-Page Optimization — The Complete A to Z Mega Guide
- A Complete Guide to Automated Sitemap Management for Modern SEO
- Module 13: Algorithm Updates and Analysis — The Complete A to Z Mega Guide
- Module 14: Technical SEO Optimization — The Complete A to Z Mega Guide
- Module 15: Video Marketing Through YouTube — The Complete A to Z Mega Guide
- Module 16: Email Marketing — The Complete A to Z Mega Guide
This article was written by Sayad Md Bayezid Hosan for the SmartGen blog. For free tools to support your digital marketing journey, visit smartgentools.com.