
July 10, 2026 • General • By Sayad Md Bayezid Hosan
MODULE 18: Customization and Advanced Features — The Complete A to Z Mega Guide for Beginners
A complete, step-by-step A to Z guide to advanced Google Analytics work — how to set up Google Tag Manager from scratch, how to build custom dimensions and custom metrics in GA4, how to use real-time analytics and GA4 intelligence events to catch problems and opportunities early, and how to analyze data, spot genuine trends, and turn it all into data-driven reports and recommendations someone can actually act on.

What This Guide Covers
Before we dive in, here's the honest map of everything this mega guide walks through, step by step:
- What Google Tag Manager is, and a full walkthrough of setting up your first container, tag, and trigger
- The difference between custom dimensions and custom metrics in GA4, with two complete worked examples
- How to use real-time analytics to test your own tracking, and how GA4's automated intelligence events work
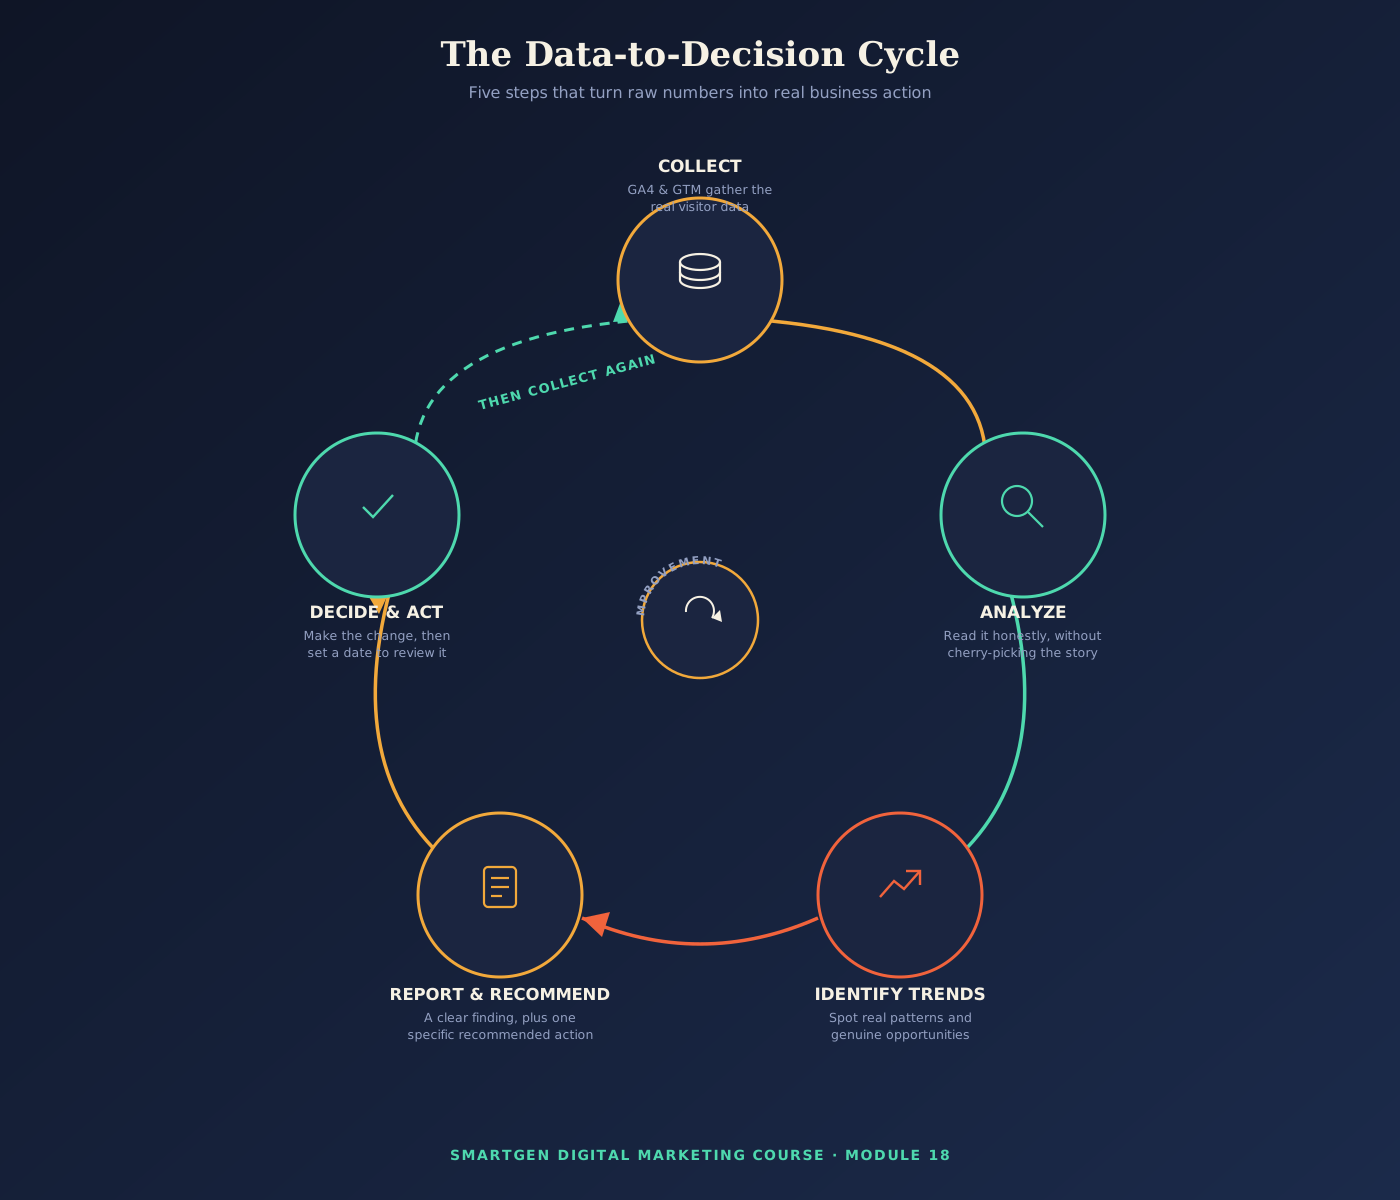
- A repeatable, honest framework for turning raw data into real decisions
- How to tell a genuine trend apart from ordinary daily noise, and where real opportunities usually hide
- How to build a data-driven report someone will actually read and act on, including a full sample report you can copy
- A quick-reference glossary of every term used in this guide, for whenever you need a fast reminder
Welcome to Module 18: Customization and Advanced Features
In Module 17, we opened Google Analytics for the first time, learned to navigate it without getting lost, and made sense of the core metrics — bounce rate, session duration, conversions, traffic sources — that answer the most common questions any website owner has. That's the foundation, and it will serve you well for a long time.
This module is for what happens next: the point where the standard reports have answered the standard questions, and you find yourself wanting to track something Google Analytics doesn't measure automatically, or needing to turn a pile of numbers into an actual decision instead of just another chart to glance at. That's genuinely a different skill from the one Module 17 taught, and it's the one this module is entirely dedicated to building.
We're going to cover two connected things, in real depth. First, the technical side: Google Tag Manager, custom dimensions and metrics, and GA4's real-time and automated intelligence features — the tools that let you capture exactly the data your specific business actually needs, walked through as literal, numbered, step-by-step instructions rather than just concepts. Second, the strategic side: how to actually analyze that data, spot real trends instead of random noise, and turn all of it into reports and recommendations that lead to a genuine decision. Neither half is useful without the other — data you can't capture can't be analyzed, and data you never analyze was never worth capturing in the first place.
A quick, honest note on where this guide comes from: everything in this module reflects the actual, hands-on process of setting up and testing this exact tracking on SmartGen's own site while this course was being built — not textbook theory copied from a manual. When a step is genuinely fiddly for a beginner the first time, I've tried to say so plainly, and where Google's own interface is the final source of truth (since Google does occasionally rename or relocate features), I've pointed you toward Google's own official Tag Manager and Analytics documentation directly, rather than asking you to take my word for it alone.
If you haven't gone through Module 17 yet, I'd genuinely recommend starting there first, since this module builds directly on top of it. Here are all the earlier lessons in this course:
- Introduction to Online Digital Marketing: A Beginner's Guide
- Module 3: Social Media Marketing (SMM) — Advertising Concepts and Platform Selection
- Module 4: Meta (Facebook) Marketing — The Complete A to Z Mega Guide
- Module 5: Instagram Marketing — The Complete A to Z Mega Guide
- Module 6: X (Formerly Twitter) Marketing — The Complete A to Z Mega Guide
- Module 7: LinkedIn Marketing — The Complete A to Z Mega Guide
- Module 8: Pinterest Marketing — The Complete A to Z Mega Guide
- Module 9: Creating a WordPress Website — The Complete A to Z Mega Guide
- Module 10: Search Engine Optimization (SEO) — The Complete A to Z Mega Guide
- Module 11: Off-Page Optimization — The Complete A to Z Mega Guide
- A Complete Guide to Automated Sitemap Management for Modern SEO
- Module 13: Algorithm Updates and Analysis — The Complete A to Z Mega Guide
- Module 14: Technical SEO Optimization — The Complete A to Z Mega Guide
- Module 15: Video Marketing Through YouTube — The Complete A to Z Mega Guide
- Module 16: Email Marketing — The Complete A to Z Mega Guide
Why I'm Writing This Guide the Way I Am
There's a real risk, once you start learning terms like "Tag Manager" and "custom dimensions," of sliding into pure technical trivia — collecting more and more data simply because you now know how, without ever connecting it back to a real decision. I've watched that happen to genuinely smart beginners, and honestly, I've done it to myself while building out SmartGen's own tracking: getting a custom dimension configured perfectly and then never once opening a report to actually look at it.
So this guide is deliberately built in two connected halves, walked through in real, literal, step-by-step detail rather than just concepts you nod along to, and I want you to read them as one continuous idea rather than two separate topics. The first half teaches you exactly how to capture the data you need, click by click. The second half teaches you what to actually do with it once you have it. Skipping either half leaves you with either data you can't get, or data you don't know what to do with — and this module exists to make sure you leave with both, and with a level of detail thorough enough that you can follow along on your own site as you read.
1. Introduction to Google Tag Manager
What Google Tag Manager Actually Is
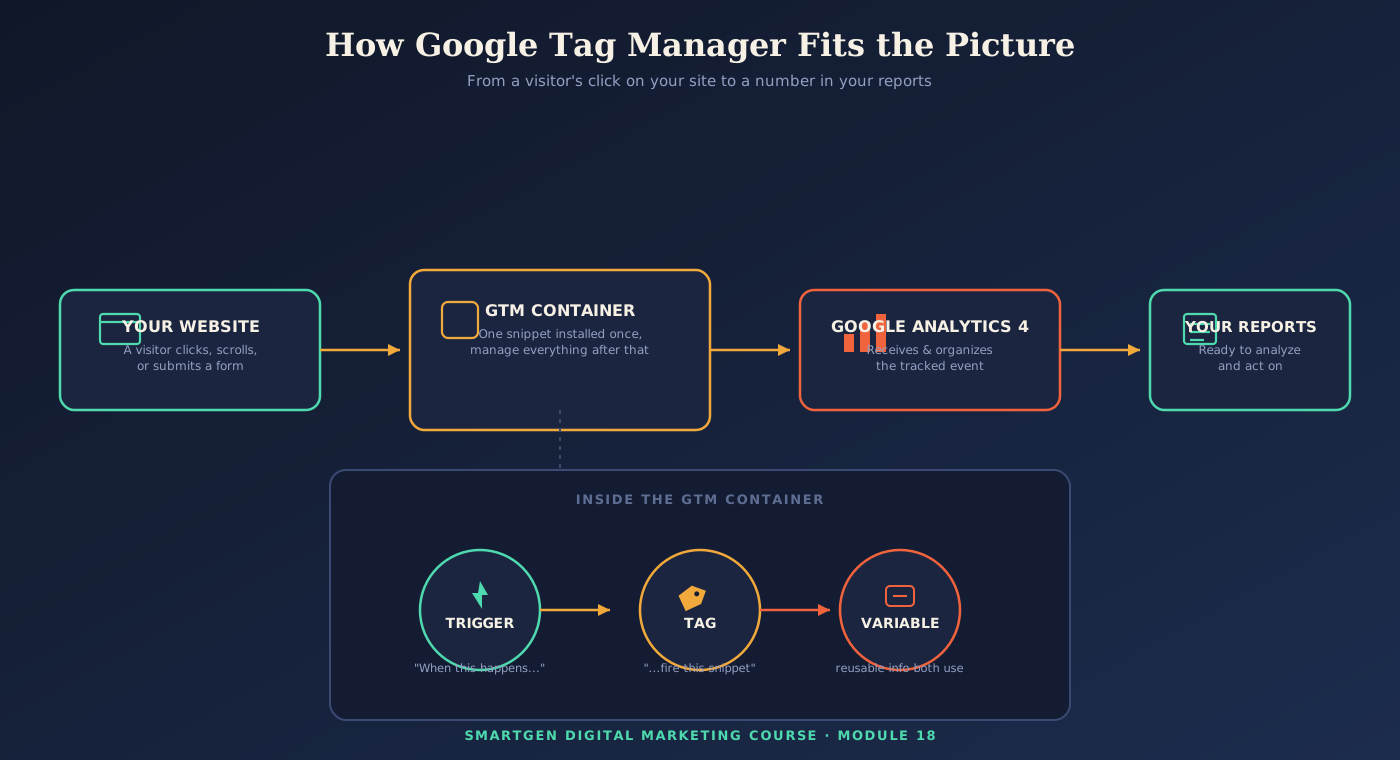
Google Tag Manager (GTM) is a free tool that lets you add, manage, and update tracking codes on your website through a simple visual interface — without needing to edit your WordPress theme files or wait on a developer every time you want to track something new.
Here's the practical problem GTM solves. Back in Module 17, you added a Google Analytics tracking snippet to your site. That covers standard behavior automatically — pageviews, sessions, basic engagement. But what about the moment someone clicks your "Download the Free Checklist" button? Or submits your contact form? Or scrolls all the way to the bottom of a long guide? None of that is tracked automatically, and without GTM, adding that kind of tracking would normally mean writing and inserting custom code directly into your site every single time. GTM removes that barrier entirely, and it's genuinely one of the highest-leverage free tools a non-developer marketer can learn.
The Three Core Building Blocks
Everything in Google Tag Manager is built from three connected pieces, and understanding how they relate to each other is the single most important thing in this section.
Tags are the actual tracking snippets that do something — most commonly, sending an event or configuration to Google Analytics 4, but tags can also fire other tracking pixels or scripts, such as a Facebook Pixel referenced back in Module 4.
Triggers define when a tag should fire — for example, "when someone clicks any element with the class download-btn," "when a form is successfully submitted," or "when a visitor scrolls past 90% of the page."
Variables are reusable pieces of information that both tags and triggers can reference — things like the current Page URL, the text inside a clicked button, or a custom piece of information you've defined yourself.
Put simply: a trigger decides when something happens, a tag decides what fires in response, and variables supply the specific details both of them need along the way.
The Trigger Types You'll Actually Use as a Beginner
GTM offers many trigger types, but a small handful cover the overwhelming majority of what a beginner marketer needs:
- Page View fires the moment a page finishes loading — the simplest trigger, used for your core GA4 Configuration tag.
- Click – All Elements fires when literally anything on the page is clicked, and is typically paired with a filter (like "Click Classes contains
download-btn") so it only fires for the specific element you care about. - Click – Just Links works the same way but is scoped specifically to
<a>link elements, useful for tracking outbound links to other websites. - Form Submission fires when a visitor successfully submits a form — ideal for tracking newsletter sign-ups or contact form completions.
- Scroll Depth fires once a visitor scrolls past a percentage threshold you set (commonly 25%, 50%, 75%, and 90%), letting you measure how far people actually read down a long guide like this one.
- YouTube Video fires based on video milestones — start, progress percentages, and completion — genuinely useful if you're embedding the video content covered back in Module 15.
Step-by-Step: Setting Up Your First GTM Container
Here is the exact sequence, from a completely empty account to a working GA4 connection:
- Go to tagmanager.google.com and sign in with the same Google account you used to set up Google Analytics in Module 17.
- Click "Create Account." Enter your business or site name as the Account Name, and your website's domain as the Container Name.
- Select "Web" as the target platform when prompted, then click Create, and accept the Terms of Service.
- Copy the two code snippets GTM immediately shows you. One goes as high as possible in your site's
<head>section, and the other goes immediately after the opening<body>tag. On a WordPress site, the simplest route (matching the beginner-friendly approach from Module 9) is a dedicated header-and-footer or Tag Manager plugin, which inserts both snippets for you without editing theme files directly. - Publish an empty container first to confirm installation. Visit your live site, then return to GTM and use Preview mode (covered in Section 3) to confirm the container is loading correctly, even before you've built a single tag.
- Create your first tag: from the GTM workspace, click "Tags" → "New," choose "Google Analytics: GA4 Configuration" as the tag type, and paste in the Measurement ID from your GA4 property (the same one set up in Module 17).
- Set the trigger for this tag to "All Pages" (the default Page View trigger), then save and name the tag clearly, such as "GA4 – Base Configuration."
- Publish the container using the blue "Submit" button in the top-right corner, giving your version a short, clear name like "Initial GA4 setup" so you can track your change history over time.
Step-by-Step: Building Your First Custom Click Tag
Once your base configuration is live, here's how to track something specific — using a "Download the Free Checklist" button as a concrete example:
- Create a new trigger first: Triggers → New → choose "Click – All Elements," and set it to fire on "Some Clicks," not all clicks.
- Set the condition to match your specific button — commonly "Click Classes" or "Click ID" contains the exact class or ID name used in your button's code (your WordPress developer settings or theme's page builder can usually show you this).
- Name the trigger clearly, such as "Click – Download Checklist Button."
- Create a new tag: Tags → New → "Google Analytics: GA4 Event." Give the event a clear name, such as
checklist_download. - Attach the trigger you just built to this new tag, so the event only fires on that specific click.
- Save, then test immediately using Preview mode (covered fully in Section 3) before publishing, to confirm the event actually fires when you click the real button on your live site.
- Publish the container once you've confirmed it works, using a clear version name like "Added checklist download tracking."
Troubleshooting: Why Isn't My Tag Firing?
This happens to every beginner at least once, so here's a genuine checklist rather than vague reassurance. Check that the container is actually published — a tag built but never submitted will never fire on your live site. Check the trigger's exact condition — a mistyped class name or an extra space is the single most common cause of a "silent" tag. Confirm you're testing on the correct URL — a trigger scoped to a specific page path won't fire if you're testing from a different page. Use Preview mode (Section 3) rather than guessing, since it shows you, in plain language, exactly which tags fired and which didn't for every single click and page load. Clear your cache or use an incognito window if you're using a caching plugin from Module 9, since a cached page can sometimes serve an older version of your site without your newest GTM changes.
2. Custom Dimensions and Metrics
Why the Standard Reports Aren't Always Enough
Google Analytics automatically collects a broad, genuinely useful set of standard information — page, device, location, traffic source, and more, all covered in Module 17. But every business eventually runs into a question the standard categories simply weren't built to answer: which specific author's articles perform best? Which membership tier of logged-in users converts most often? Which of your Module 12 content buckets — Strategy, Formula, Writing, Bucketing, Measurement — actually drives the most engagement? None of that exists as a standard GA4 category, because it's specific to your business, not universal to every website on the internet.
That's exactly what custom dimensions and metrics exist for.
Custom Dimensions vs. Custom Metrics
A custom dimension is a custom category or label you define yourself — a piece of descriptive information like "Author Name," "Membership Tier," or "Content Bucket." A custom metric is a custom numerical measurement you define yourself — something like "Article Word Count," "Video Watch Percentage," or "Estimated Reading Time in Minutes."
Both can be scoped in one of two ways, and this distinction matters more than beginners expect: event-scoped data applies to one specific event only (which specific button was clicked, on which specific page), while user-scoped data describes the actual person and stays attached to them across every session they ever have going forward (their membership tier, their signup date, their preferred language).
Step-by-Step: Creating a Custom Dimension From Start to Finish
This is where Sections 1 and 2 connect directly, and it always happens in this exact order:
- Decide what you actually want to capture and give it a clear, consistent parameter name using lowercase and underscores — for example,
content_bucket. - In Google Tag Manager, create a new Data Layer Variable (or a DOM/JavaScript variable, depending on how the value is available on your page) that captures this value from your site.
- Edit your GA4 Event tag (or your base configuration tag, for information that should appear on every pageview) and add an "Event Parameter" — the parameter name is
content_bucket, and the value is the variable you just created. - Publish your GTM container so the parameter actually starts being sent along with the relevant events.
- Confirm it's arriving correctly using GTM's Preview mode alongside GA4's Realtime report (Section 3), checking under the event's parameters for your new
content_bucketvalue. - In GA4 itself, go to Admin → Custom Definitions → Custom Dimensions, and click "Create Custom Dimension."
- Give it a clear display name (such as "Content Bucket"), choose the correct scope (event-scoped, in this example), and select the matching event parameter (
content_bucket) from the dropdown. - Wait roughly 24–48 hours for GA4 to begin populating historical reports with the new dimension — it will not retroactively apply to data collected before this step was completed, only from this point forward.
A Worked Example: Tracking Content Buckets
Following the steps above with content_bucket as your event parameter, once a few weeks of data have accumulated, you can finally answer a question the standard reports could never answer on their own: open an Exploration (from Module 17), set Content Bucket as your dimension, and compare engagement rate and conversion rate side by side across your Strategy, Formula, Writing, Bucketing, and Measurement content from Module 12 — closing the loop on that entire content bucketing discipline with real, direct evidence instead of a guess.
A Second Example: Tracking Author Performance
If more than one person writes for your site, a content_author custom dimension, set up the same way, lets you compare which author's work tends to earn longer engagement time, more scroll depth, or a higher conversion rate — genuinely useful for an editorial team deciding where to invest more writing time, and a very natural extension of the exact same setup process above.
A Note on Limits
GA4 caps the number of custom dimensions and metrics available per property, and while Google has periodically raised these limits, it's worth checking your own property's current allowance under Admin → Custom Definitions before assuming unlimited room. In practice, most small and medium-sized sites never come close to hitting the ceiling if they follow the next piece of advice closely.
Common Mistakes When Setting Up Custom Dimensions
Registering the custom dimension in GA4 before the GTM parameter is actually flowing correctly is the most common ordering mistake — always confirm the raw parameter is arriving first, using Realtime, before creating the formal GA4 definition. Using inconsistent parameter values (mixing "Writing," "writing," and "Blog Writing" for what should be the same category) will silently fragment your reporting into several near-duplicate rows instead of one clean one. Defining dimensions speculatively, without a real question behind them, quietly burns through your limited quota on data you'll likely never actually analyze — a direct echo of the "define the question first" discipline covered later in Section 4.
3. Real-Time Analytics and Intelligence Events
Going Deeper on Real-Time Data
Module 17 introduced the Realtime report as a way to confirm that something just worked. With Google Tag Manager now in your toolkit, Realtime becomes even more useful in a second way: as an immediate testing tool. The moment you publish a brand-new tag or trigger in GTM, open the Realtime report and perform the action yourself — click the button, submit the form, scroll the page. If your new custom event doesn't appear within moments, that's an immediate, clear signal that something in the trigger or tag setup needs a second look, long before you'd otherwise have noticed a gap in your standard reports days or weeks later.
Step-by-Step: Testing a New Tag Using Realtime and Preview Mode Together
- In GTM, click "Preview" in the top-right corner and enter your site's URL when prompted — this opens your site in a connected debugging session.
- Perform the exact action you're testing (click the button, submit the form) on the preview-connected tab.
- Check the GTM debug panel that appears alongside your site, confirming your specific tag shows as "Fired" rather than "Not Fired" for that action.
- Open GA4's Realtime report in a separate tab, and look under "Event count by Event name" for your new event (such as
checklist_download) appearing within moments. - Click into the event in Realtime to confirm any custom parameters (like
content_bucket) are attached with the correct value, not blank or mistyped. - Only publish the container in GTM once both the debug panel and Realtime confirm everything is working exactly as expected.
GA4's Automated Intelligence Events
Beyond what you actively look for, GA4 includes a built-in feature — often shown behind a small lightbulb icon and referred to as Analytics Intelligence — that uses automated pattern detection to surface things in your data that are statistically significant, without you having to go looking for them. This includes automatically-generated Insights, which flag notable, unusual changes (a sudden spike in conversions from a specific channel, an unexpected drop in engagement on a key page), and a conversational query feature that lets you type a plain-language question about your own data and get a direct answer pulled from your reports.
Example Questions Worth Actually Asking
A few genuinely useful prompts to try inside GA4's conversational analysis feature: "What was my conversion rate last month compared to the month before?", "Which channel sent the most users last week?", "What are my top landing pages by engaged sessions this month?" Treating this feature as a fast first-pass question tool — rather than your only source of analysis — is exactly the right way to use it alongside the deeper techniques in Sections 4 through 6.
Why This Deserves a Regular Place in Your Routine
Treat GA4's automated Insights as a genuine second set of eyes on your data — not a replacement for the intentional analysis covered in the rest of this module, but a valuable supplement to it. Build a simple habit of checking it alongside your regular reporting routine; it's specifically designed to catch the kind of meaningful shift you might not have thought to go looking for on your own, precisely because you didn't know to ask the question yet.
A Mid-Guide Reality Check — What I Actually Want You to Walk Away Understanding
We've just covered three genuinely technical tools — Tag Manager, custom dimensions, and automated intelligence — with real, literal steps you can follow on your own site, and it's worth pausing here before we shift gears completely.
None of what we just covered is valuable on its own. A perfectly configured custom dimension that nobody ever looks at is wasted effort. An Insight that flags a real, significant change but gets dismissed without a decision behind it might as well have never been generated. The entire point of everything in Sections 1 through 3 is to feed better, more specific, more relevant data into the process we're about to cover — because better inputs only matter if what comes after them is genuinely rigorous too.
That's exactly the shift the rest of this module makes: from capturing the right data, to actually using it — analyzing it honestly, spotting the trends and opportunities that are genuinely real rather than random noise, and turning all of it into something concrete enough that you, or someone else, can act on it directly.
4. Analysing Data to Make Data-Driven Decisions
The Core Mindset Shift
There's a meaningful difference between collecting data and using it, and most beginners get stuck on the collecting side without ever fully crossing over. Making that crossing requires a specific mindset: every time you open a report, you should already have a real question in mind — not "let me see what's interesting today," but something specific like "did last month's email campaign from Module 16 actually move the needle on conversions?"
A Simple, Repeatable Decision Framework
Start by defining the actual question before opening any report at all — vague curiosity produces vague, unusable conclusions. Pull only the data genuinely relevant to that question, using the specific tools from this module and Module 17: a segment comparison, a secondary dimension breakdown, a custom dimension report. Interpret it honestly, actively watching for the pitfalls in the next subsection rather than reaching for whatever conclusion is most convenient or flattering. Decide on one concrete action — not a vague intention, but something specific enough that you'd know immediately whether you'd actually done it. Set a real date to review the result, so the loop actually closes instead of quietly trailing off.
A Worked Example From Start to Finish
Let's make this concrete. Imagine your actual question is: "Did last month's email newsletter from Module 16 actually drive meaningful blog traffic?"
Define the question: specifically, did sessions tagged with the email UTM source convert at a meaningfully different rate than your overall site average?
Pull the relevant data: open Traffic Acquisition, filter to Session Source/Medium containing your newsletter's UTM values, and compare its engagement rate and conversion rate against your site-wide averages from the same date range.
Interpret honestly: suppose the email segment shows a 4.8% conversion rate against a 2.1% site-wide average — a real, meaningful difference, not just one or two lucky conversions inflating a tiny sample.
Decide on one concrete action: increase newsletter send frequency from monthly to biweekly for the next quarter, and specifically feature one piece of Module 12 content per send rather than a generic roundup.
Set a review date: revisit this exact comparison in eight weeks, with a calendar reminder, to see whether the higher-frequency approach maintained that same conversion advantage or diluted it.
Common Pitfalls That Quietly Undermine Good Analysis
Confusing correlation with causation is the single most common mistake: two things moving together doesn't automatically mean one caused the other — a traffic increase that happens to coincide with a new blog post might actually be driven by an unrelated seasonal trend or a mention on someone else's site.
Drawing conclusions from too small a sample is nearly as common — a 20% jump in conversion rate looks dramatic until you realize it came from three conversions instead of two, which is well within normal random variation rather than a meaningful signal.
Chasing vanity metrics over actionable ones connects directly back to Module 17's bounce rate discussion — a metric that looks impressive but doesn't actually connect to a real business outcome (raw pageviews with no corresponding conversions, for instance) can quietly steer your decisions in the wrong direction if you let it.
A Simple Beginner's Test for "Is This Difference Real?"
You don't need a statistics degree to apply a reasonable gut check before trusting a comparison. Ask yourself honestly: is this based on at least a few dozen conversions or events on each side of the comparison, not just a handful? Does the pattern hold up if you extend the date range a little longer, rather than only appearing in one unusually short window? Would you be equally confident announcing this finding to someone else and defending it, or does it feel like you're already reaching to make the numbers support a conclusion you wanted going in? If any of those honestly give you pause, treat the finding as a hypothesis worth watching for another few weeks, not a conclusion worth acting on yet.
5. Identifying Trends and Opportunities
Separating Real Trends From Ordinary Noise
Website data naturally moves up and down day to day for reasons that have nothing to do with anything you did — a slow Tuesday, an unusually busy Friday, a random dip nobody can fully explain. A genuine trend is a pattern that holds up over a meaningful stretch of time and survives a fair comparison, not a single good or bad day. The most reliable way to check is comparing like periods against each other: week-over-week, month-over-month, or — especially useful if your business has any seasonal rhythm — the same period one year earlier.
Where Real Opportunities Tend to Hide
A few specific, genuinely productive places to look, each one connecting back to an earlier module in this course. Pages with strong search visibility but a weak click-through rate (a pattern you can spot using Google Search Console alongside the technical SEO principles from Module 14) often just need a stronger title or meta description, covered back in Module 10, to convert existing visibility into more actual visits. A smaller channel with an unusually high conversion rate, found by comparing segments as described in Module 17, often represents real, underinvested potential — a channel worth deliberately growing rather than one to overlook simply because its total volume looks small today. A specific content bucket from Module 12 that, once tracked through the custom dimension work in Section 2 of this module, consistently outperforms the others is a direct, evidence-based signal about where your next few pieces of content should focus. Recurring seasonal patterns in your traffic or conversions are worth deliberately planning your content calendar around in advance, rather than noticing them retroactively every single year.
A Trend-Spotting Checklist
Run through this short list any time you think you've spotted something worth acting on: has this pattern held for at least three to four comparable periods in a row, not just one? Have you compared it against the same period last year, if your business has any seasonal element at all? Have you ruled out an obvious external explanation — a holiday, a site outage, a tracking change from Section 1 or 2 of this module — before concluding it reflects genuine audience behavior? Have you checked whether the pattern holds across more than one segment or channel, or whether it's really being driven by just one unusually large outlier?
Using This Module's Tools Together as a Trend-Spotting Kit
The real power shows up when you combine everything covered so far: use GA4's automated Insights (Section 3) as an early prompt, then use a secondary dimension (Module 17) or a custom dimension (Section 2) to dig into exactly why that prompt appeared, then use a segment comparison (Module 17) to confirm the pattern actually holds across a meaningful, comparable slice of your audience rather than being a fluke.
6. Creating Data-Driven Reports and Recommendations
What Separates a Useful Report From a Screenshot Dump
A genuinely useful report is not a folder of exported charts with no narrative attached. The single most common mistake in this final step is handing someone — a client, a manager, or even yourself a month from now — a pile of numbers and expecting them to do the work of figuring out what it all means. A good report does that interpretive work for the reader, every time.
The Structure Every Good Report Should Follow
Lead with the headline finding, stated in one plain sentence, before any chart or supporting number appears — never bury the actual conclusion at the bottom of a page of data. Support it with the specific data or visual that backs that finding up, kept tightly focused rather than including every metric you happened to look at along the way. Explain the "so what" — why this finding actually matters for the business, connecting it to a real goal rather than presenting it as an interesting fact in isolation. End with one specific, concrete recommendation, phrased as an action someone could actually take this week, along with a realistic sense of the impact you'd expect if they took it.
A Sample Mini-Report You Can Copy
Here's exactly what that four-part structure looks like in practice, using the worked email example from Section 4:
Finding: Our email newsletter is quietly our highest-converting channel, at more than double the site average.
Supporting data: Over the last 30 days, sessions from our email newsletter converted at 4.8%, compared to a 2.1% site-wide average, based on 62 total newsletter-driven conversions.
Why it matters: We currently send this newsletter only once a month, meaning we're likely leaving meaningful, high-intent traffic on the table by under-using our best-performing channel.
Recommendation: Move to a biweekly send for the next quarter, featuring one Module 12 content piece per email, and re-evaluate the conversion rate again in eight weeks to confirm the higher frequency hasn't diluted engagement.
Presenting to Non-Technical Stakeholders
If the person reading your report doesn't work in analytics day to day, resist the urge to explain your entire methodology up front. Lead with the plain-language finding and recommendation first, and keep any mention of specific metric definitions or dimensions brief and only as needed to support the point — most people reading a report want the conclusion and the next step, not a walkthrough of how GA4's Explore feature works.
Tools for Building and Sharing Reports
For a simple, recurring report like the one above, a short written summary or a basic slide is often genuinely enough — over-engineering the format can eat into time better spent on the actual analysis. For a more visual, frequently-updated dashboard, Looker Studio (Google's free reporting and visualization tool) connects directly to GA4 and lets you build a shareable, continuously-updating report without exporting anything manually, which is worth exploring once your reporting habit is well established.
Building This Into an Ongoing Habit
Just as Module 8 and Module 12 both built the case for a simple, recurring monthly review habit, the same discipline applies here at the reporting level. Build a consistent cadence — monthly is a reasonable default for most small businesses — rather than only producing a report reactively when something goes wrong. A consistent rhythm of small, honest, action-oriented reports, built up over many months, will teach you far more about your real audience than any single deep-dive report ever could on its own.
Quick-Reference Glossary
Bookmark this table for whenever you need a fast reminder of what a term in this module actually means.
| Term | Plain-Language Meaning |
|---|---|
| Tag | A tracking snippet that fires and sends data somewhere, like GA4 |
| Trigger | The condition that decides when a tag should fire |
| Variable | A reusable piece of information a tag or trigger can use |
| Custom Dimension | A custom category or label you define, like "Content Bucket" |
| Custom Metric | A custom number you define, like "Word Count" |
| Event-scoped | Data attached to one specific action or event only |
| User-scoped | Data attached to a person, carried across all their sessions |
| Segment | A defined subset of users or sessions you isolate to study |
| Secondary Dimension | A second breakdown column added to an existing report |
| Key Event | GA4's current term for a tracked conversion |
| Insight | An automatically-flagged, statistically notable change in your data |
A Note on Accuracy and Continued Learning
Google periodically renames and relocates features inside both Google Tag Manager and GA4, exactly the kind of interface drift covered conceptually back in Module 13. Everything in this guide reflects the current interface and terminology as of this writing, tested directly rather than assumed. If a specific button or menu path ever looks different from what's described here, Google's own official Tag Manager Help Center and Google Analytics Help Center remain the authoritative, up-to-date source of truth, and this guide will be revisited and updated as the platform evolves.
Module 18 Mega Guide Summary
In this module, we covered what Google Tag Manager is and how its three core building blocks — tags, triggers, and variables — let you track virtually anything on your site without touching your theme's code, complete with a full step-by-step container and tag setup walkthrough, how custom dimensions and metrics let you capture the specific data categories that matter uniquely to your business, with two full worked examples, how real-time analytics and GA4's automated intelligence events help you both test new tracking instantly and catch meaningful changes you weren't specifically looking for, and how to move from raw data to genuine decisions through honest analysis, real trend identification, and reports built around a clear finding and a specific recommendation rather than a pile of disconnected charts.
Practice exercise: Set up one simple custom event in Google Tag Manager — tracking clicks on a specific button or link that matters to your business — and confirm it appears correctly in GA4's Realtime report using the debug workflow from Section 3. Then define one custom dimension based on something specific to your own content or audience (an author, a category, or a content bucket from Module 12), following the full eight-step process in Section 2. Once a few weeks of data have accumulated, write your own short, four-part report on it, following the exact structure and sample shown in Section 6.
Frequently Asked Questions
Do I need Google Tag Manager if I'm only running a small blog?
Not necessarily right away — GA4's automatic tracking covers a lot of ground on its own, which is exactly what Module 17 focused on. GTM becomes genuinely valuable the moment you want to track something specific beyond standard pageviews, like button clicks, form submissions, or scroll depth, which is common even for fairly small sites.
How many custom dimensions should I actually set up?
Start with just one or two tied to a real, specific question you actually want answered, rather than defining a large list speculatively. GA4 does cap the total number of custom dimensions and metrics available per property, so it's worth using them deliberately rather than filling up that space with ones you'll never actually look at.
Is Google Tag Manager difficult to learn if I'm not a developer?
The core concepts — tags, triggers, and variables — take a bit of getting used to, but the interface itself is entirely visual and point-and-click. Most beginners can comfortably build and test their first simple click or form-submission tag within a single sitting, especially using GTM's built-in Preview mode to check their work as they go, following the exact steps in Section 1.
What should I do if GA4's automated Insights flag something I don't understand?
Treat it as a starting prompt rather than a final answer: use a secondary dimension or a segment comparison, both covered in Module 17, to dig into exactly what's behind the flagged change before deciding whether it actually requires any action.
How do I know if a trend I've spotted is real or just random variation?
Compare it against a fair, like-for-like period — the same days of the week, the same month a year prior, or at minimum several consecutive weeks showing the same direction — rather than drawing a conclusion from a single unusually good or bad day. The trend-spotting checklist in Section 5 walks through this in more detail.
What's the actual difference between a GA4 "conversion" and a "key event"?
They refer to the same underlying idea — a specific action you've marked as meaningful enough to track as a genuine outcome — but Google has moved toward calling these "key events" within GA4 specifically, to avoid confusion with the separate "conversions" terminology used inside Google Ads.
Who is the actual audience for the reports described in Section 6?
It could be a client, a manager, a business partner, or simply yourself a month from now. Regardless of who's reading it, the same structure applies: lead with the finding, support it briefly, explain why it matters, and end with one specific action — the discipline matters more than who's on the receiving end.
Can I really learn all of this without a technical or analytics background?
Yes. Every step in this guide is written to be followed by someone learning this for the first time, using the visual, point-and-click interfaces both GTM and GA4 provide rather than requiring code. The most important skill isn't technical fluency — it's the discipline of defining a real question before pulling any data, covered in Section 4.
— Written by Sayad Md Bayezid Hosan for the SmartGen blog
 ✓
✓
Sayad Md Bayezid Hosan
Founder & Tech Entrepreneur | Full-Stack Developer
Full-stack Web Developer, Digital Marketing Strategist, and Tech Entrepreneur with 5+ years of experience delivering innovative digital solutions. Specializing in web development, AI integration, strategic digital marketing, and tech entrepreneurship. As a leading Tech Provider, I help audiences navigate digital platforms safely through permission-based technical solutions and digital business asset management.
Credentials & Expertise:
- Founder of CWB Agency & GenZFrontier
- Final-year English Student at Northern University Bangladesh
- Specialized in AI-powered web development & content strategy
- Published author on tech, digital marketing & entrepreneurship
What's Next?
In the next module, we'll continue building on these analytics and decision-making foundations. Take a moment to revisit the earlier lessons in this course if you need a refresher, since each module builds on what came before it:
- Introduction to Online Digital Marketing: A Beginner's Guide
- Module 3: Social Media Marketing (SMM) — Advertising Concepts and Platform Selection
- Module 4: Meta (Facebook) Marketing — The Complete A to Z Mega Guide
- Module 5: Instagram Marketing — The Complete A to Z Mega Guide
- Module 6: X (Formerly Twitter) Marketing — The Complete A to Z Mega Guide
- Module 7: LinkedIn Marketing — The Complete A to Z Mega Guide
- Module 8: Pinterest Marketing — The Complete A to Z Mega Guide
- Module 9: Creating a WordPress Website — The Complete A to Z Mega Guide
- Module 10: Search Engine Optimization (SEO) — The Complete A to Z Mega Guide
- Module 11: Off-Page Optimization — The Complete A to Z Mega Guide
- A Complete Guide to Automated Sitemap Management for Modern SEO
- Module 13: Algorithm Updates and Analysis — The Complete A to Z Mega Guide
- Module 14: Technical SEO Optimization — The Complete A to Z Mega Guide
- Module 15: Video Marketing Through YouTube — The Complete A to Z Mega Guide
- Module 16: Email Marketing — The Complete A to Z Mega Guide
- Google Web Analytics — The Complete A to Z Mega Guide for Beginners
- Mobile, Cross-Device & Campaign Analytics — The Complete A to Z Mega Guide for Beginners
This article was written by Sayad Md Bayezid Hosan for the SmartGen blog. For free tools to support your digital marketing journey, visit smartgentools.com.